|

| |
Old "What's New" News
April 8th, 2018
Kintecus V6.70 released:
- If you are getting "fatal error # 995 This version
of kintecus has expired". Please download this version to correct that
error!
User Defined Chemical Rate Equations
=======================================
Enhancements: longer variable names,
international support bug fixes
"Global Data Fitting/Regressing with Multiple User Defined
Constraints"
============================================================
Enhancements: international support and
various small bug fixes
Marquardt-Levenberg should be working, though it seems to only work
for two variables. It does converge very quickly...
This version allows a user to modify any of the 15 Marquardt-Levenberg
parameters
January 7th, 2018
- If you are getting "fatal error # 995 This version
of kintecus has expired". Please download this version to correct that
error!
These are some new features in Kintecus V6.51:
User Defined Chemical Rate Equations
=======================================
The special USER function is new in Kintecus V6.01. You can use it to define
your own chemical kinetic rate equations like this:
"A+B+S[USER;(variable list separated by commas) : (chemical kinetic function) ]"
(<=== Note the semi-colon, ";", after USER and a colon, ":" after the variable
list!)
Example:
"H+O2+S[USER;M,T,cH2,cN2,cH2O:(M-cH2-cN2-cH2O+cH2*2.86+cN2*1.26+cH2O*18.6)*3.61e17*T^(-1*0.72)*exp(-0.0/(8.314*T))]=HO2"
* You must define all variables utilized in the function as a comma delimited
list.
You can use T for the current temperature, P for Pressure, M for Loseschmidt's
value, R for gas constant,
and cXXXXXXX for concentration of species XXXXXX, ie. concentration of CH4 would
be cCH4.
* The user function supports natural logarithm (log), logarithm base 10 (log10),
most trig functions
(sin, cos, tan, atn, acos), hyperbolics (cosh, sinh, etc), square root (sqrt),
absolute value (abs),
exponent (exp) and other functions. For negative exponents (for example 1^-.6)
you have to
multiply it by minus one (-1), so 1^-0.6 become 1^(-1*0.6).
* Please see the Kintecus-Excel spreadsheet
“Combustion_workbook_OH_user_defined_functions.xls”
as an example of various user defined chemical kinetic rate equations.
==========================================================================================================================
Inclusion of Initial Conditions for Regression/Fitting:
=======================================
One can now also regress/fit the initial conditions for a species (or
temperature) in any of the initial_conditions.txt file.
This can be done by suffixing any numeric value in an initial condition file
with a question mark, “?”.
Example, if the second data set had an unknown concentration of oxygen (using a
guess of 2E19 molec/L) and a user
wish to regress this against the data, then these two lines in the
initial_conditions.txt will change
FROM:
temp=615 ; isoprene=1.43e14 ; O2=1.89e19
temp=610 ; isoprene=1.73e14 ; O2=2e19
TO:
temp=615 ; isoprene=1.43e14 ; O2=1.89e19
temp=610 ; isoprene=1.73e14 ; O2=2e19?
(note the question mark appended to 2e19)
==========================================================================================================================
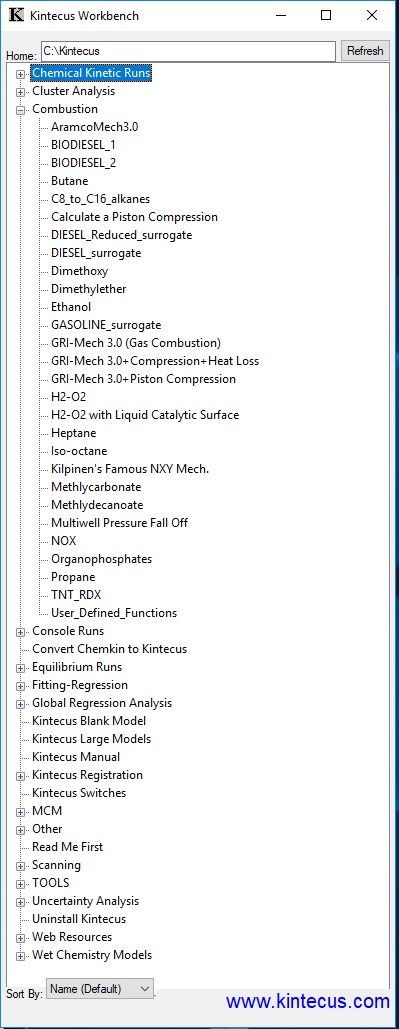
A new Kintecus Workbench. Easy GUI launching of models/codes/scripts
and allows one to add your own models/scripts/documentation/etc.
Click the "Other==>Add Your Own Stuff to the
Kintecus Workbench" to add your own models/documentation/homework/weblinks/etc
==========================================================================================================================
Also, there are bug fixes, primarily in
"Global Data Fitting/Regressing with Multiple User Defined Constraints"
January 1st, 2018
1/1/2018 - If you are getting "fatal
error # 995 This version of kintecus has expired". Please download a temporary
executable located on the download page.
A new Kintecus package will be shortly provided here as
well as a list of additional features in 6.51 soon...
February 18, 2017
Kintecus 6.01 has been released.
- This version should be able to handle all of LLNL combustion
models including those that have PLOG reactions
- This version can also apply any type of constraints in equation form
between any of variable or constants for use in regression/fitting.
Several dozen LLNL models have been converted over to Kintecus. Several Biodiesel model
surrogates, gasoline surrogate, diesel surrogates and their reduced models as
well as some pure models (isooctane, carbonates, etc). There are also some
organophosphate and TNT models from LLNL converted .
Also, the ck2kin (Chemkin to Kintecus converter) has been updated and should
be able to handle most new chemkin models especially those at LLNL (where all
the models below originated) and those at Combustion Chemistry Centre at
National University of Ireland, Galway. The C3 lab has some useful models such
as ARAMCOMECH 2.0/3.0 (2016/17) models which Kintecus fully supports.
October 9th, 2016
A few more bug fixes with the beta version of Kintecus. (download rar file here,
you'll need unrar to unrar the executable).
October 2nd, 2016
Kintecus 5.9b beta (download rar file here,
you'll need unrar to unrar the executable).
- This version should be able to handle all of LLNL combustion
models including those that have PLOG reactions
- This version can also apply any type of constraints in equation form
between any of variable or constants for use in regression/fitting.
Several dozen LLNL models have been converted over to Kintecus. Several Biodiesel model
surrogates, gasoline surrogate, diesel surrogates and their reduced models as
well as some pure models (isooctane, carbonates, etc). There are also some
organophosphate and TNT models from LLNL converted .
Also, the ck2kin (chemkin to Kintecus converter,
click here to download) has been updated and should
be able to handle most new chemkin models especially those at LLNL (where all
the models below originated) and those at Combustion Chemistry Centre at
National University of Ireland, Galway. The C3 lab has some useful models such
as ARAMCOMECH 2.0 (2016/17) models which Kintecus fully supports.
August 21st 2016
Kintecus 5.8b beta (download rar file here,
you'll need unrar to unrar the executable).
- This version should be able to handle most of LLNL combustion
models minus those that contain PLOG// entries.
- It can also apply any type of constraints in equation form between
any of variable or constants.
I will be support PLOG// in Kintecus in a few weeks. I've
converted several dozen LLNL models over to Kintecus. Several Biodiesel model
surrogates, gasoline surrogate, diesel surrogates and their reduced models as
well as some pure models (isooctane, carbonates, etc) have been ported. There
are also some organophosphate and TNT models from LLNL converted .
Also, the ck2kin (chemkin to Kintecus converter,
click here to download) has been updated and should
be able to handle most new chemkin models especially those at LLNL (where all
the models below originated) and those at Combustion Chemistry Centre at
National University of Ireland, Galway. The C3 lab has some useful models such
as ARAMCOMECH 2.0 (2016/17) models.
October 24th 2015
Kintecus V5.75 has been release!
- A few Windows10 issues corrected with
packaging
-A few bugs corrected
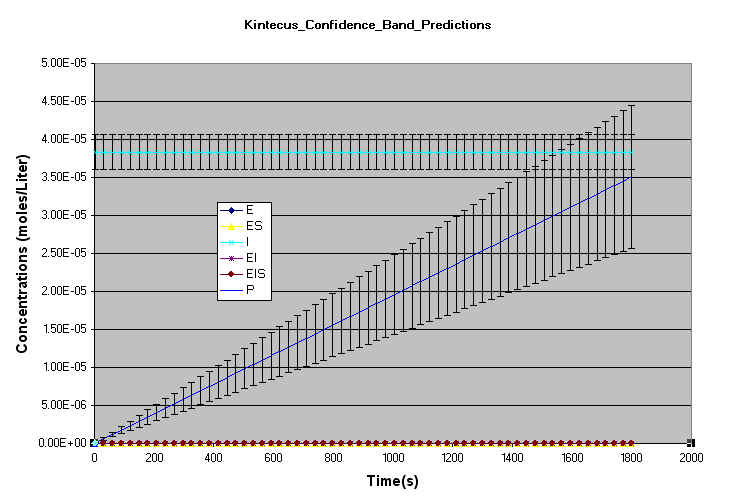
-The ability to output confidence values for
confidence/uncertainty runs
April 18th, 2015
Kintecus V5.5 has been released!
New features include:
-1- Support for most of the special IUPAC chemical kinetics forms from
the Master Chemical Mechanism (MCM) ( see http://mcm.leeds.ac.uk/MCM/parameters/complex.htt
, http://www.iupac-kinetic.ch.cam.ac.uk/
and/or http://iupac.pole-ether.fr/
-2- Chebyshev expansions proposed by Venkatesh[32] for representing
pressure fall off and temperature dependant rates of multiple well reactions
-3- Users can utilize the OUTC[] operator(b) for a species for
reaction rates that involve families of species such as "ROH=[C2H5OH]+[C3H7OH]+[C4H9OH]+..."
-4- More issues with boot-stapping and global regression analysis have
been corrected for Windows 8 and up.
-5- Kintecus package also comes now in non-package form. You won't need
admin privileges to "install it", *BUT* you WILL NOT HAVE a nice, easy clear
Kintecus START menu that identifies the hundreds of sample Kintecus files. Installing the
package form is highly recommended!
-6- General enhancements.
Details:
-1- Master Chemical Mechanisms (MCM) Forms
Kintecus V5.5 and up now support some of the special IUPAC chemical kinetics forms from
the Master Chemical Mechanism (MCM) ( see http://mcm.leeds.ac.uk/MCM/parameters/complex.htt
, http://www.iupac-kinetic.ch.cam.ac.uk/
and/or http://iupac.pole-ether.fr/ or
Google/Bing "Master Chemical Mechanism"). Most of the these forms pertain with
special pressure fall-off reactions that cannot be fully cast into the traditional Troe,
Lindemann forms. Shown below are some those forms. The sample Kintecus-Excel worksheet
“Kintecus_MCM_examples.xls” workbook contains examples of each MCM reaction
explained below. Note that some of these forms have sub-forms that perform differently
depending on the amount of parameters given. Also note that all rate forms shown below
include k(T)=A*T^m*exp(-Ea/RT) as part of their rate equation form but they are not
explicitly shown as part of it.
Also, under the Windows Kintecus TOOLS start-menu is a utility (for linux users it is
under the MCM sub-directory), created by Dr. Fred Winiberg of JPL, that will convert most
FACSIMILE codes containing MCM kinetic forms to a Kintecus MODEL spreadsheet. For more
details please see manual.
-2- Multiple-well, Multiple-channel Reactions Utilizing Chebyshev Polynomials
Kintecus V5.5 and up now support the Chebyshev expansions proposed by Venkatesh[32] for
representing pressure fall off and temperature dependant rates of multiple well reactions.
Please see those references for the list of equations that are utilized in Kintecus to
calculate those rates.
To request these Chebyshev polynomials, one uses the “CHEB” keyword in the
follow format
A , m , Ea, Reactants + M[CHEB; Matching_Keyword; scaling_factor] ==> Products
The presence of the CHEB keyword will cause Kintecus to look for a text file named
“chebdata.txt”. The text file chebdata.txt will contain all your reactions that
might use a multiple-well, multiple-channel Chebyshev polynomials reaction. For more
details please see manual.
-3- Users can utilize the OUTC[] operator for species for reaction rates that
involve families of species.
Please see the Kintecus-Excel workbook “Kintecus_workbook_MCM_examples.xls”
as an example. Note the OUTC[ ] operator present in the "Species Special
Directives" columns inside the workbook
“Kintecus_workbook_MCM_examples.xls” . Species RO2 will always be equal to the
sum of the concentrations of CH3O2 and CHO for whatever reaction the species family RO2
appears in. It is possible to define one species family with other families. One could
have R=RO2+RH where RH is the sum of another set of species. Just be sure the larger
families appear further down in column A as Kintecus sums the families top to bottom.
January 12th, 2014
Kintecus V5.01 has been released. Some new features include:
* Global Data Regression/Fitting/Optimization Analysis:
Kintecus V5.0 and up now supports an extremely powerful global data
regression/fitting/analysis. You can regress or fit or optimize multiple
datasets that have multiple initial conditions such as temperatures,
pressures, concentrations or any combination and with data sets that have
different time scales, different time steps, different species, temperature
profiles, heat output, different amount of data points, etc. There are many
sample Kintecus-Excel worksheets demonstrating some basics of this
new global regression:
Enzyme_Regression_Fitting_Multiple_Datasets_and_initial_conditions.xls
POLYMER_MULTIFIT_MULTICONDITIONS.xls
Combustion_workbook_OH_multifit.xls
Enzyme_Regression_Fitting_Multiple_Datasets.xls
The above examples demonstrate biological, combustion and polymer
global experimental regressions.
For graphing, please remember that the Kintecus-Excel plotting
macros have been substantially updated to handle multiple data plotting
for Global Regression Analysis. This means if you wish to
use Global Regression Analysis you must copy your worksheets
to any of the above listed Kintecus-Excel Workbooks or the blank
Kintecus_workbook.xls Workbook.
* Fitting/Regressing with Heat Output:
Kintecus V5.00 and up now supports the ability to regress/fit
against heat generated during a reaction. This is accomplished by specifying
“OUTC[SYSTEMH]” in the “Species Special Directives” column listed in
the
Species worksheet for a species with the name of “enthalpy”. An example
Kintecus-Excel workbook demonstrating this is,
“Combustion_workbook_OH_enthalpy_fit.xls”. Note that the experimental
output containing the heat output must be named “enthalpy” for Kintecus
to latch on and regress against.
* Transport Catalytic Reactions
Transport catalytic reactions are concerned with gas to liquid interactions.
Kintecus provides two types of optional fits to this reaction. For an
example of this type of reaction, please see the
“H2-O2-combustion-gas-liquid-catalytic-surface-test.xls” sample
Kintecus-Excel worksheet
August 5th, 2012
Kintecus V4.55 has been released. Bug corrections with:
* Kintecus Scanning Bug *
There is a bug in the scanning mode of Kintecus (the "-scan" flag). It
only happens when one is utilizing thermodynamics mode (the "-THERM"
flag is provided on the command line) and in constant pressure mode
("YES" is in the "Constant Pressure" field located on the PARM
worksheet). The bug is that Kintecus will use the initial pressure
for the very first scan run to be enforced in all subsequent scan runs
instead of resetting the pressure for each new scan. The bug has been
corrected.
January 14th, 2012
Kintecus V4.50 has been released. Bug corrections with:
-Kintecus will detect Infinite loops with
regression/optimization and either halt/restart the optimizer.
( the tests.bat script now includes about 10 more tests. This should catch any future bugs
with the optimizer/regression in Kintecus)
-Bug correction with Bootstrapping
-During SCANNING runs, it seems in Windows Vista/7 would
interfere with the just created Kintecus SCANNED files.
A small delay has been installed to prevent Windows from corrupting SCANNING files and
causing NaN's and/or crashes
September 5th, 2011
Kintecus V4.40 has been released. Bug corrections with:
- reactions that have more than three products and
fraction stoichiometric coefficients (global reactions).
- integrator #5 now produces more accurate results and
works with NSA analyses
- more minor corrections to third-body reactions with
enhanced body coefficients.
- both 32-bit and 64-bit available for Linux
July 2nd, 2011
Kintecus V4.35 has been
released. This version has some minor corrections to third-body reactions with enhanced
body coefficients.
May 1st, 2011
Kintecus version 4.10 has been released for both 32- and
64-bit Windows systems and a 64-bit version for Linux. Those that utilize the
thermodynamics mode of Kintecus with constant-pressure and/or constant-volume and/or
bimolecular Lindmann pressure fall-off reactions (i.e. A+B+M[LIN;1.2;2.1;4400] ==> ...
...) will want to download the new version and test against their models as two possible
bugs were discovered. Under the new code, one's models might show temperature
changes from 5%-30% depending on the heat capacity change accompanied by temperature
changes with constant pressure. Some might see little changes (the sample O2-H2 constant
pressure combustion model that comes with Kintecus shows little change). Those
working under a constant-volume with thermodynamics and have no bimolecular Lindmann
pressure fall off reactions can ignore this update.
February 27th, 2011
Kintecus version 4.01 has been released for both 32- and
64-bit Linux systems. Please go to the download page to obtain the corresponding tar
files.
Also, a new educational license scheme has been released for University/College
supercomputing centers that have Linux systems. It is possible to install Kintecus on
those systems for free. Please contact jianni10 at the address of @gmail.com for details.
August 22nd, 2010
Kintecus version 4.00 has been released at www.kintecus.com. The entire system has been
recompiled under Intel’s latest FORTRAN compilers to produce very fast code that also
"plays well" with the newer CORE i7 chips. For some speed comparisons, see table
below. In addition, all the Kintecus-Excel worksheets have been redesigned to work with
Windows 7 both 32 bit and 64 bit. The 32-bit version of Kintecus should still work with
Windows 98/XP/Vista/2000/NT. The Kintecus V4.00 also has some new features such as:
- the DASPK integrator that can be invoked through "-INT:5" switch. This new
integrator can handle tough combustion models that can break the other integrators. In
some cases speedups of over 100 times (10,000%) are possible. For example, the
Chlorate-Iodine sample reactions model takes about 3 minutes to run utilizing
"-INT:1", but finishes under 2 seconds with the DASPK integrator. Note that it
is not a silver bullet and it is still recommended to stick with the first integrator,
"-INT:1", then followed with the DASPK integrator, "-INT:5", if
continued problems persist, then followed by #4, #2 and #3 integrators. See manual for
further details.
- Jet Propulsion Laboratory 4-parameter fit to the Troe expression ( see section 2 at http://jpldataeval.jpl.nasa.gov/download.html
) chemical kinetic forms are now supported
- Various bug fixes
- The chemkin to Kintecus converter tool and the other tools have been recompiled and
should run under Windows7 as well as Windows Vista/XP.
The linux versions (32 and 64 bit) should be released in a week
or so.
Kintecus Version 4 Speedups
Note that all speedups are attributed to a recompiling of the
Kintecus source code utilizing the Intel 11.1 FORTRAN compilers. Spectacular speedups on
the orders of magnitude are possible with the new DASPK integrator invoked through the
"-INT:5" Kintecus command switch.
CASE #1) Normalized Sensitivity Analysis run of the Ethanol
Combustion Model #1
The old 3.96 version of Kintecus required 2 hours and 2 minutes.
The new version completes it in 1 hour and 10 minutes and the 64 bit version completes the
run in 1 hour 2 minutes.
CASE #2) Execution of the test.bat batch script that runs most
of the batch models in the Kintecus directory. This amounts to several dozen runs
featuring combustion, wet chemistry, Normalized Sensitivity Analysis, uncertainty
analysis, regression, optimization, global equilibrium runs, cluster analysis, parametric
scans, perturbation runs and many other type of runs.
The old 3.96 version of Kintecus requires 18 minutes to run test.bat.
The new 4.0 version completes all runs in 8 minutes.
April 3rd, 2010
>>> As stated on the Kintecus
group site ( http://tech.groups.yahoo.com/group/kintecus/
)
several months ago: There is a slight issue with Windows-7 and the Kintecus-Excel
spreadsheets (see below).
Kintecus will still run normally as the issue does not affect the
Kintecus program. There is a temporary
fix (see below) if this issue is an annoyance.
>>> A fifth integrator has been added to Kintecus: DASPK. This
integrator is about 10 times (10,000%)
faster than the
default BD integrator in handling combustion runs. Please email jianni10[ el atto mailo ]gmail.com for
access to
this version if you really need it. The next release of Kintecus will have it available.
>>> There is small numerical inaccuracy for constant pressure
runs with thermodynamics. If your system
experiences a too large cooling affect accompanied by an indirect compression (a
compression that is not
directly caused by a piston) then please request an updated version of Kintecus that
corrects this possible
inaccuracy. If your system experiences an overall heating event (like an ignition), you
can
probably ignore this update.
>>> I will also be releasing 32-bit and 64-bit versions of
Kintecus for Linux and a 64-bit version for Windows
with direct support of Intel's Ultra-highspeed QuickPath (on the Core-i7 chips) for
double-precision numbers.
Temporary Fix for Windows 2007 / Kintecus-Excel interface :
There appears to be a small bug related to the ability of the Kintecus-Excel
interface to re-run a Kintecus job that completely fails (a job that fails so
completely that Kintecus is un-able to catch the error). There is a fix for this
and the next Kintecus package will have these corrections. If you are impatient
then you can perform the fix yourself: In the Kintecus-Excel interface, open the
Visual Basic editor (Tools => Macros => Visual Basic Editor), select the Module1
and change this line in Module1
FROM:
KPID = Shell("command.com /c kpause.bat" & " " & KCMD, 3)
TO:
KPID = Shell("kpause.bat" & " " & KCMD, 3)
(the change is "command.com /c" is deleted). It appears Windows 7 no longer has
the command.com program.
September 6th, 2009
Kintecus V3.962 has been released to correct the problem
with reactions that have more than four products.
August 1st, 2009
Some international users who have installed a
non-English version of Windows98/XP/Vista
were not able to run Kintecus because Kintecus could not generate a unique computer
ID for their computer. This should be fixed with Kintecus V3.961. If you have experienced
this problem, please download Kintecus V3.961.
July 18th, 2009
Kintecus version 3.96 has been released.
Main features:
- Support for up to 10 products. You can now do some serious
global reaction modeling.
- Weights/standard deviation support for experimental data during
fits/regression.
All you have to do is specify the weight or standard deviation in parenthesis
after your datapoint(s).
- Special Species Directives that will significantly help in tough
regression fits of
experimental data that is a composite of multiple species. This feature has many important
uses in regression and data analysis. For example, you are monitoring four wavelengths
for absorbance, but each wavelength contains the absorbance from another species, so
one cannot extract the concentrations from a kinetic one because one does not know
how much "contamination" from another species absorbance, so you could not
perform
any data analysis with such an experiment.
Now you can.
- The ability to scale the energy source/sink with respect to changing
volume
in a constant pressure run.
- Now specify a table (can be an Excel Worksheet) containing variable time steps
for
normalized sensitivity analyses. This is useful for mechanism reduction and
elucidation.
Actually, you can do this with any version of Kintecus, but you had to crunch the numbers
on the command line and could only do about 30 variable steps. Now you can do up to a
thousand and have them all specified and easily seen/plotted on an optional Excel
worksheet.
Bugs Corrected:
There is one notable bug in Kintecus 3.95 or below. If you are utilizing Normalized
Sensitivity
Analysis (NSA) with no temperature program and/or no thermodynamics turned on
(via the –THERM switch) AND you are utilizing non-zero Arrhenius parameters (not just
a
rate constant), then those reactions with non-zero Arrhenius parameters with always have
a Normalized Sensitivity Analysis coefficient of zero (0). Kintecus V3.96 has this bug
corrected.
Again, this bug is fairly limited in scope as most users that use NSA either have
thermodynamics
on, or are only utilizing rate constants, k (not A, m and Ea), in their model with
no thermodynamics.
August 3rd, 2008
There was a bug with the "-scan" switch.
Depending on the type of simulation, the initial species
concentrations that were non-zero would randomly be changed from 0-4% (under a Gaussian
type
distribution) between each scan. It is recommended one download the new corrected Kintecus
version 3.953 and re-run any previous scans to be sure one's output does not significantly
change.
January 13th, 2008
Kintecus V3.95 has been released. Kintecus V3.95 has a new
integrator (invoked via the -INT:4 switch) that
can handle low-temperature (300 K) combustion runs and some stiff chemical kinetic systems
that
the first two integrators occasionally cannot handle.
Kintecus V3.95 will not run at all without a valid unlocking key that is unique to each
computer.
Also, some minors bugs have been fixed.
May 27th, 2006
A new version of Kintecus has been released (Kintecus V3.90) and Atropos (V1.20)
Prime new features :
1) A new feature in Kintecus V3.9 is the ability to perform complex
hierarchical cluster analysis on
temporal concentration profiles of the network with/without experimentally obtained
temporal concentration
profiles. Hierarchical cluster analysis in Kintecus has the ability to group
related and unrelated parts of temporal
concentration profiles in a meaningful, quantitative way. This grouping allows a user to
clearly see patterns that
were initially indiscernible or hidden.
"Why should I care about that?"
Cluster Analysis can significantly help in answering questions:
>> Analyze ALL species and determine which species or groups of species (or
subgroups, etc.)
are positively, zero or negatively correlated to each other and with other groups/species
in
either a pictorially or numeric output or both. This allows one to answer questions such
as:
>> What concentrations of E and S cause EIS to positively (or negatively or zero)
correlate with
EI ? or with ES? Or both? etc. For combustion, you can now finally answer that
question that has been bugging you since you were seven years old: If I combinatorially
scan H2,
O2 and temperature over a wide range, do the O and OH radicals always positively correlate
and also positively correlate (or negatively or zero) correlate with other species?
>> Determine which species in one's experimentally determined concentration profile
are
positively, zero or negatively correlated with all the modeled species temporal profiles.
Again, this can be grouped into a pictorially or numeric output.
>> Which species’ concentration profiles tend to stay in the same range of
concentration values?
>> There are other questions one can answer utilizing the myriad of cluster
techniques Kintecus
provides that the author has not fully examined…
Here is a small sample from a cluster analysis on the simple enzyme inhibition model:
                ++++++++++++++++++++++++++++++++++++++++++++++++++++++++++++++++++++++++++++++++++++++
             EIS************
                           *
                           8************************
                           *                       *
              EI************                       *
                                                   *
                                                   10************
                                                   *            *
              ES************************           *            *
                                       *           *            *
                                       9************            *
                                       *                        *
               E************************                        *
                                                                *
                                                                11***********
                                                                *           *
               I*************************************************           *
                                                                            *
                                                                            12***********
                                                                            *           *
               P*************************************************************           *
                                                                                        *
                                                                                        13************
                                                                                        *
               S*************************************************************************
                ++++++++++++++++++++++++++++++++++++++++++++++++++++++++++++++++++++++++++++++++++++++
A much more thorough examination can be read in the Kintecus documentation .
Cluster analysis becomes quite a powerful tool when coupled with combinatorial scanning
(see the Scanning Section
to see how to set up a Combinatorial Scan).
2) Several more reaction types
Why should I care about that?"
* Include those reactions that do not seem to follow
standard/enhanced Arrhenius or RRKM forms. This is
primarily for plasma and nuclear reactions.
3) The True Global Equilibrium feature is more robust in
solving systems near or at plasma temperatures and/or
multi-phasic systems.
"Why should I care about that?"
* When one was examining the true equilibrium composition of a system over a wide
temperature range, occasionally the system would not converge at some temperature values.
The final plot of such a system would show “spikes” at the non-converged values
and the user was forced to either drop that point, or change the non-linear solver values
by hand until the system converged. You DON’T have to do this anymore.
4) Coupling of combinatorial scanning with output files such as system
thermodynamic output, rate fluxes, species fluxes, cluster analysis, Jacobian output,
eigenvector/eigenvalue output of the Jacobians.
"Why should I care about that?"
* Helps one to determine ALL the possible maximum and minimum concentrations,
temperatures, System Cp, H, G, viscosity, rates, fluxes that a system can have if one
varied species X and Y (or temperature or pressure) in all possibilities and combinations?
MAJOR BUG FIXES
1) If you tried to compute the eigenvalue and eigenvectors of the Jacobian matrix, this
would cause an instant crash.
This has been fix as of last year, but I only handed that version out to those that asked
about this bug.
2) You can now create more than 100 (up to 1,000) Normalized Sensitivity Analysis Matrix
files.
If you are planning to perform chemical mechanism reduction and elucidation with Atropos
make sure you download the updated Atropos program (V1.1).
Other general enhancements and minor issues resolved.
==============================================================================
ATROPOS 1.20 HAS BEEN RELEASED ********
Mainly several bug issues have been corrected as well as several enhancements such
as the ability to read up to 1,000 normalized sensitivity coefficient matrix
files.
==============================================================================
June 8th, 2005
Kintecus V3.8 has been released. In addition to the
changes described below
under the May 1st, 2005 description. Here are some more
features:
Gas Heating/Cooling Via Compression/Expanding
==============================================
Compression/Expanding a gas will cause heating/cooling
via dynamic pV^(gamma) where gamma is calculated
dynamically. The ideal value of 1.4 for gamma is NOT used,
but is calculated from weighted heat-capacities of all
the species present at the respective current temperature.
The heat-capacities are calculated from the 15 coefficient
thermodynamic database.
Cell Compartments
===================================
You can use fractional rate-stoichiometric coefficients
for cell compartments of different volumes. For example,
to describe the peroxynitrate (PNA) diffusion/convection
from the cell-nucleus to the cell-membrane where the cell
membrane is, say, 1/7 the volume of the nucleus and
one also knows the diffusion-rate-constants between the
nucleus and membrane (lets just say, D=.1, D'=.01) for
PNA, the two reactions can be written as (keep in mind
0.14286 is about 1/7):
0.1 , PNA{nucleus} ==> 7 PNA{membrane}
0.01, PNA{membrane} ==> 0.14286 PNA{nucleus}
General Additions
==========================================================
- the regression/optimizer is more robust.
- Two more random number distributions added to the
Uncertainty Analysis: Poisson and Gamma.
- the Kintecus-Excel Graphical Interface can now
load/plot normalized
sensitivity analysis matrices and scans:

May 1st, 2005
This was posted in the Yahoo Kintecus User's group back in March
2005, so
here it is again....
If anyone needs the below features right now, I can directly email you
Kintecus V3.8 with those new features:
Equilibrium Constant Constrained Rate Constant Fit
===================================
If you have determined the equilibrium constant of a
reaction then you can constrain the backward rate
constant against the equilibrium constant during a
fit. This is accomplished by specifying the forward
rate constant of a reaction multiplied by 1/Keq, i.e.
(assuming Keq is 3.0)
1.0e+8? , E + S ==> ES
k1*0.333333? , ES ==> E + S
This allows one to reduce the total number of rate
constants by half, so if you have 20 rate constants
to fit, but you determined the equilibrium constants
of all 10 reversible reactions, then there are only
10 rate constants to fit.
Low Temperature Combustion Runs
===================================
Kintecus V3.8 will be able to model low temperature
combustion runs. You can have the initial temperature
of the model (such as GRI-MECH3.0) to start in
the temperature range of 200K to 500K and the model
will run and not crash.
More Robust Integrator
===================================
Large temperature spikes, volume compressions
and large concentration changes in external
user perturbations that happen later in a simulation
with thermodynamics turned on would normally crash
or require one to start with a very small Accuracy
and/or a small Maximum Integration Time which would
dramatically slow down a run. Kintecus V3.8 can
detect these spikes and adjust to finish a
simulation.
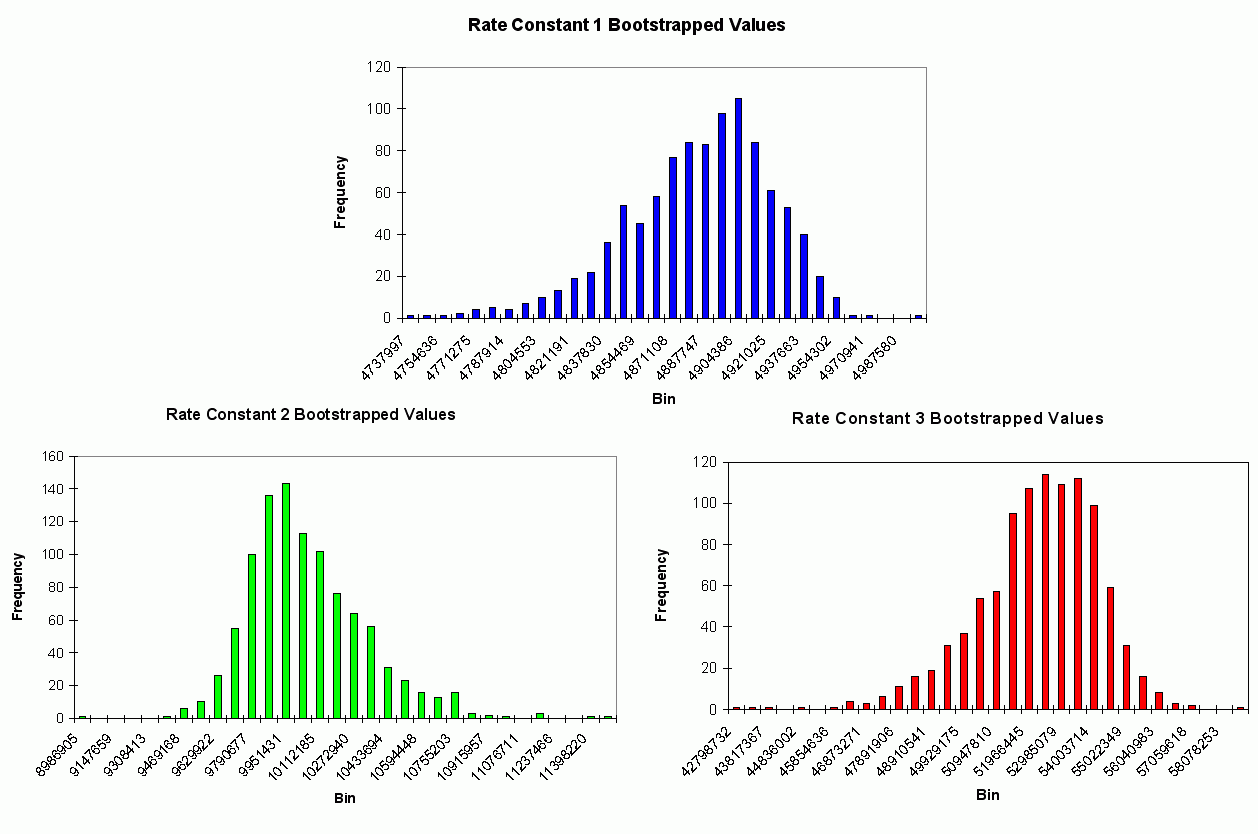
Bootstrapping Standard Deviations
===================================
Kintecus V3.8 will allow one to bootstrap fitted
or optimized parameters (ie. k, Ea, m, initial
concentrations/temperature, third-body enhancements)
to determine their actual standard deviations. This
allows for much more accurate determinations of standard
deviations. The default method that is in Kintecus
V3.7 and practically all other simulation programs
is the asymptotic approximation which is known
to give incorrect values and even magnitudes, yet,
it is practice in many referred journals and
publications.
Scanning Parameters (also called Sweeping)
===================================
Kintecus V3.8 will allow one to scan any parameter(s)
(initial concentrations, temperature, residence times,
third-body enhancements, TROE factors, etc.)
in a variety of ways and stepsizes. Sequential,
parallel-stop, parallel repeat, combinatorial scans
(sweeps) of any parameter or parameters will all be easily
accomplished.
CSTR/PFR inlet temperature flow
===================================
You can now specify a different global temperature for all
inlets of a CSTR/PFR run.
January 17th, 2005
- Kintecus V3.7 has been released ...
- See below under the December 13th, 2004 news to see some
of the new features!
An extremely important new feature is the
capability to calculate model uncertainty
in order to answer questions such as:
- What is the maximum dosage the patient can take?
- What is the chance that the boiler/CSTR/PFR might explode or have low yield?
- Why does the engine knock in real conditions, but does not do so under simulations
that use nominal values?
- Why do some atmospheric simulations show high [OH] when experimental data shows
low [OH] concentrations or visa-versa ?
- Does the reduced chemical mechanism (created with Atropos) fall within the same
range of concentrations, temperature, G, H, A, etc. as the original, larger
chemical mechanism ?
The ability to calculate the average concentration (and
temperature) time profile with
uncertainty (represented by either standard
deviation bars or confidence bands) is, most likely,
the most important and last procedure one
should do to validate a model. Turanyi et al.[28] has
shown that NOT performing such a procedure
and using only one-run time profiles is quite naïve
as it is very likely the
chemical kinetics/thermodynamics and NOT transport/convection
processes that are
controlling the concentration and temperature
profiles. A good analogy would be a hurricane
forecaster that only shows one single
possible path a hurricane can take with no uncertainty
bands or an average path! In addition, the
uncertainty analysis in Kintecus also gives one a
"smeared-out" sensitivity analysis
on ALL the parameters/constants in a model as well as
possible maximum and minimum time profiles
concentrations (and temperature) can take on
during the course of all the simulations.
- It is HIGHLY RECOMMENDED that if you are using the Excel
graphical interface, then
you should copy all your model, species, parm spreadsheets into the newer
Kintecus V3.7 spreadsheets. The newer spreadsheets have additional code to
plot uncertainty/confidence bands, system properties and various bug fixes.
- Click on the Graphical Interface button on the
left to see various new types
of plots available!
December 13th, 2004
- Kintecus V3.7 will be released soon...
- Kintecus V3.7 will have a substantial overhaul of its
fitting/optimization. Kintecus
V3.7 will now output many more statistical descriptions about how well
the
fitted data compares with the experimental data, descriptions on the
uncertainty
of the selected parameters (such as rate constants, initial
concentrations, third
body enhancements, TROE factors, etc.) and statistical descriptions on
the
important residuals. In fact, you could say Kintecus V3.7 outputs many
more statistical gauges than other "SASSIER" programs that
just do statistics.
Click here for a sample enzyme rate
constants fit or here for the classic
Oregonator oscillator/clock reaction
constant fit!
- Some commercial clients have been asking for an addition to
Kintecus that can
calculate uncertainty curves for the prediction. This is much like what hurricane
forecasters
do with hurricane paths. As one respected client states, "Can you imagine if a
hurricane
forecaster only showed the average path of a hurricane without the uncertainty band?
" Yes,
there would be bloody hell to pay. Kintecus V3.7 will incorporate this with an extremely
versatile means of specifying uncertainty in ANY of the constants (rate constants,
TROE factors, residence times, temperature, Cp, Cv, H, S, G, A, concentrations,
etc. etc.) in any distribution (uniform, gaussian, etc.) with any number of repeated runs
(which can range from several hundred to several thousands of runs
depending on the
size of the model). (see below)
June 30th, 2004
- Kintecus V3.5 has been released! Please see the June
20th history below to see all the
additions, changes and bug fixes. There's one additional addition not listed below,
plotting
templates! For those tired of that old, drab looking concentration and temperature plots,
you have Kintecus use your own plot templates automatically!
June 20th, 2004
Kintecus V3.5 will be released soon, here is a list of the new
features
and bug fixes:
<< Dynamic Mode >>
- Now you can finally control Kintecus through the new dynamic
mode! Kintecus V3.5 has a new mode that allows one to pause Kintecus, examine the current
concentrations, temperature, rates, system properties, residence times, external
concentration, etc, alter any of those properties, and continue. This allows one to
control Kintecus dynamically in a feedback manner. Feedback control can be a very
complicated and broad area which is beyond the scope of this document. Please consult an
appropriate text book on this subject. Dynamic mode in Kintecus is invoked through
including the "-dynamic[:wait time]" switch on the command line. A very simple
example is provided through using VBA scripts to control Kintecus in dynamic mode is
provided as Excel Workbook, "Combustion_H2_Dynamic.xls". Again, any programming
language that can output files can be used to control Kintecus.
<< Optimization / Fitting / Maximization /
Minimization >>
- A new feature in Kintecus V3.5 is the ability to extract molar
extinction coefficients (also known as molar absorptivity or epsilon from A=epsilon * l *
c ) from a series of absorbance values or a series of concentration values multiplied by
some weight. A sample Excel Spreadsheet name Enzyme_Regression_Molar_Extinct.xls
demonstrates this feature. The fitdata worksheet now contains absorbance values (instead
of the usual concentration values) recorded at some wavelength. To extract molar
extinction coefficient(s) (or a weight factor) from your absorbance values, give the
-FITWEIGHT switch on the command line with these options:
-FITWEIGHT:X1:Y1[:X2:Y2:X3:Y3:Xn:Yn]
Where X represents the column number in your fitdata
file/worksheet and Y represents the starting weight guess.
- CONSTRAINTS! You can now apply a constraint to any parameter
you are optimizing/fitting. The constraints allow one to specify lower and upper bounds
for a parameter. Constraints are applied by appending your guess with (lower<upper)
where lower is the lower numeric bound and upper is the upper numeric bound. For example,
to constraint the initial temperature guess of "3000?" to lay between 1500 and
4000 simply type: "3000(1500<4000)?" .
- TWO (2) new optimization methods, Levenberg-Marquardt method
and "The Complex" (the Simplex method on steroids).
<< Heat Loss/Gain >>
- A new parameter field in Kintecus V3.5 is the External Heat
Source/Sink field. This field allows one to model External Heat Jackets or External
Temperature Baths or dynamic Heat sources and sinks. You can enter one of four types of
external heat source/temperature related items:
1) A numerical value representing an external Heat Source/Sink.
This value will be added to the dT/dt equation and with units in Kelvin/sec.
2) A filename containing a profile (formatted like a
"Constant File?" file) that represents a changing External Heat Source/Sink #
Profile (Filename) with units in Kelvin/sec.
3) TWO values: One for Conductance of the container/reactor,
followed by a COLON, ":", followed by the Extern. Temperature(K)
4) One value and a profile: the first number represents the
conductance of the container/reactor followed by a COLON, ":", followed by a
filename containing a profile (formatted like a "Constant File?" file) that
represents a changing External Temperature
<< Two new integrators >>
- The "classic" Gear BDF method
- The Adams-Moulton method
<< MORE EXCEL WORKBOOK SAMPLES >>
There will be a few more Excel workbook samples (though Excel is
not needed to run those Kintecus examples), such as computing a volume profile of a piston
and using that in a GRI-MECH 3.0 run.
************************
** MAJOR BUG FIXES *****
************************
There have been a number of minor bugs fixed and most of those
will go unnoticed, but if you are working with constant-volume (isochoric) adiabatic runs
(in kinetics mode, not equilibrium mode) or are applying a "Constant File" to a
species in thermodynamic mode then the following two major fixes will apply to you. Those
of you that only use Kintecus in Equilibrium Mode can ignore these two major bug fixes as
they only pertain to Kintecus in chemical kinetics mode.
<< MAJOR BUG CORRECTION 1 >>
* The constant-volume (isochoric) thermodynamics in some
non-isothermal adiabatic runs have been corrected so some users might see the correct
higher temperature. Again, this is model and initial condition dependent so some users
might not see any change while other might see final temperatures change upto 40% and
ignition delay changes of 10-30%. Example, the five GRI-MECH samples that come with
Kintecus show almost NO CHANGE, BUT the three ethanol combustion runs show some changes in
ignition delays. For those that are performing runs in CONSTANT-PRESSURE, then you can
safely ignore this bug fix, constant-pressure mode works fine.
<< MAJOR BUG CORRECTION 2 >>
* Running Kintecus in chemical kinetics mode with thermodynamics
and using a "Constant File" (an external concentration profile) on a species can
cause the previous versions of Kintecus to immediately bomb out with an
"Overflow" error. This made it appear it was an integration problem, but it
never was an integrator problem. The values in your Constant File were accidentally set to
either zero or to a colossal negative number. This has now been fixed and is working
properly.
May 31st, 2004
- VBA Excel Bug:
- If you store temperature/concentration/other
perturbation profiles within
an Excel Kintecus Spreadsheet or store thermodynamic databases or
Chemname files (by prefixing worksheets with "O_"), then Excel will
not write those files into the Kintecus Path. They will usually be written
to "C:\", but clicking on the RUN button
a SECOND time, forces Excel to
write to your Kintecus Path (usually "C:\Program Files\Kintecus" ).
*** FIX ***
You can wait until the next version of Kintecus to be released OR
simply
to remember after loading the Kintecus Spreadsheet, RUN the
simulation
at least ONCE whereby Kintecus will always write files to your Kintecus
Path and not "C:\" *OR*
modify
the VBA code simply by moving the following code in the Kintecus Run
Macro to right under the last DIM statement.
(Dim V1 As Double, V2 As Double, V3 As Double, nation As
Integer):
MOVE THESE PIECE OF CODE:
' goto kintecus directory
KPATH = Worksheets("CONTROL").Range("A8:A8")
If Right(KPATH, 1) <> "\" Then
KPATH = KPATH & "\"
End If
L = InStr(KPATH, ":")
PC = ""
If L > 1 Then PC = UCase$(Mid$(KPATH, L - 1, 1))
If L <= 1 Or PC = "" Or PC < "A" Or PC > "Z" Then
PC = "C"
ChDrive PC & ":"
ChDir KPATH
right under the VBA code:
Dim V1 As Double, V2 As Double, V3 As Double, nation As Integer
November 9th, 2003
- A new version of Kintecus is available: Kintecus V3.21.
This version corrects the bug
with the normalized sensitivity analysis feature. In addition, those
interested in
performing an Intrinsic Low Dimenionsal Manifold Analysis (ILDM) on a chemical
kinetic
system for use in 1D/2D/3D runs will definitely find the new eigenvalues/eigenvectors
and Jacobian output features helpful.
- Be sure to check out Atropos
! This NEW KINTECUS SOFTWARE COMPANION
will reduce large, complicated mean old chemical kinetic systems into
puppy dogs and everyone loves puppy dogs....
June 21st, 2003
** BUG DESCRIPTION **

There is a slight bug with the normalized sensitivity analysis
feature (the -SENSIT switch) of Kintecus. The bug causes Kintecus to
appear to take forever to calculate normalized sensitivity analysis
matrix files. This is noticeable if you add the "-show" switch on the
command line and you will see the time in the Time(s) column repeat
the same time forever. You will also get a CONC.TXT output file that
is extremely large and will continue to grow until it fills up the
harddisk.

** TEMPORARY FIX **

The current fix is to increase or decrease the number of normalized
sensitivity analysis matrix files you are creating using the -SENSIT
switch. For example, if you experience this error trying to output 10
normalized sensitivity analysis matrix files using -SENSIT:1:10
switch, then increase the 10 to 11 or decrease it to 9. This will
force Kintecus to select different timing meshes that do not cause it
to hang on the previous time. If you are using the other way to
compute normalized sensitivity analysis matrix files via
"-SENSIT:1:TIMES,n1,n2,n3,nn" switch, such as "-SENSIT:1:TIMES,1e-3,
2e-3, 2.5e-3, 3e-3, 4.9e-3" and suppose Kintecus is hanging on the
time of 2.5e-3 seconds, then change the 2.5e-3 time to 2.51e-3 seconds
or change it to 2.49e-3 seconds. Kintecus should be able then to
"latch on" and continue with the rest of the computation.
April 7th, 2003
- Kintecus V3.1 has been released. New features include:
a) Running Kintecus V3.1 on Pentium-IV machines will result in an almost DOUBLING in
speed. Your run's execution time will be almost cut in half!
b) Better Equilibrium solution finding for larger systems.
c) detection and correction of bad Time(s) in one's experimental data for
Fitting/Optimizations
d) Graphical Interface now includes the ability to store your perturbation files (such as
temperature programs, concentration profiles, piston compressions, etc), thermodynamic
databases, ChemName files, Periodic Tables as worksheets in your Excel Workbooks. This
allows for easy transference of entire models between groups/individuals. One can even
have a dynamic graph of a perturbation on the same worksheet that holds the perturbation
data (see the Gas_Desorption_off_Tungsten.xls Excel file) or see the
GRI-Mech_3.0.xls Excel file for a sample of holding a thermo. database in a worksheet.
e) Bug fixes. There are a number of bug fixes, one notable bug fix is that running
Kintecus in kinetics mode, under constant pressure and having a temperature profile or
concentration change of a species of more than 1 point causes Kintecus to hold the
pressure constant for the first point, but after the first point, the pressure is not held
constant. This is now fixed in V3.1.
January 30th, 2003
- *ALERT* If you are using the
Excel Graphical Interface and you are Fitting Parameters against Data then you should
download a corrected Excel worksheet HERE.
The corrected worksheet fixes the bug with experimental data in the last column of the
FITDATA worksheet being overwritten with the experimental data from the previous
column. If you are Fitting Data with Kintecus directly (you are NOT using the Excel
worksheet) then you should be fine. Also be sure to have the times in the Time(s)
column in the FITDATA worksheet to contain only 3 to 6 decimal places. Having times that
are 10 or more decimals places long (such as 1.234567890123) forces Kintecus to skip that
data point (and any other data points). It is simply impossible to force the integrator to
stop at that exact time! More example "good time
points": 1.2345E-31, or 4.54321E+50, BAD times: 0.0043322114758484 or
321.32234522344.
January 27th, 2003
- When using the Excel graphical interface and you are fitting
parameters against a dataset,
there is a bug in which Excel will overwrite the last column of data with the
previous column.
For example, if your FITDATA worksheet has Time(s) in the first column, E in the
second
column and S in the third column, when you click run, Excel will output the FITDATA
worksheet as Time(s), E and E, the third column containing data will be overwritten with
E. THIS ONLY HAPPENS IF YOU ARE USING THE
EXCEL GRAPHICAL INTERFACE. If you
directly enter your experimental data into the file "fitdata.txt" there
will be no problem. A
temporary fix is to duplicate the last column of data: i.e. in the FITDATA Excel
worksheet,
the columns: Time(s),E and S should have four columns of
data: Time(s), E,S and S
AGAIN. The next release of Kintecus and the Excel Graphical
Interface will fix this.
Also, the Periodic text file containing two columns of data: new mass/isotope
element
name, mass weights should be named Periodic.dat and NOT period.dat as stated in the
manual.
The next version of Kintecus will show a DOUBLING in SPEED using the new COMPAQ 6.6
FORTRAN compiler for Pentium IV users!
November 10th 2002
August 29th 2002
- Kintecus V3.0 has been released. The major addition to this major
upgrade are high-end equilibrium calculations without the need to purchase high-cost
software. The user wishing to do equilibrium calculations only has to specify the species
present. There is no need for the user to specify any reactions, or balance any reactions,
or even specify which species are reactants or products! Equilibrium calculations,
adiabatic (variable temperature) flame, constant pressure, multiple phases, phase
stability plots and other types of equilibrium calculations can be performed. Kintecus
fitting/optimization settings (fit initial concentrations, initial temperatures, etc,
against experimental data) , perturbation affects, system property outputs can all be
specified with the new equilibrium features. Kintecus comes with a number of sample
equilibrium runs and Excel files. Shown below is an equilibrium phase stability plot
of liquid H2SO4 slowly dispersing into various gases as the temperature is increase:

- Some minor additional features have been added to Kintecus such as
having the concentrations output in mole fractions and a more strict application to the
phases. Also a new perturbation switch has been implemented: the '-SET' switch. This
switch allows one to quickly set the concentration, temperature or volume at any time and
still have that parameter act as a variable in the model.
May 26th 2002
- Kintecus V2.80_1 has been released. The only changes were to fix
all the Excel spreadsheets so that plotting of Kintecus results by German/Russian/Polish
Excel users is correct. Yup, its that comma-dots and dots-comma Excel problem again.
Hopefully, all problems associated with those international Excel VBA sheets are now
corrected.
April 22nd 2002
- The problems some international users (Germany, Poland and Russia)
were having with the Excel Graphical Interface bombing out due to the representation of
numbers with commas has been fixed. Also, the false Kintecus bombings reported by
Excel2000 Kintecus Graphical Interface under XP or WIN95 has been corrected. Plus, now
users using the Excel Graphical Interface can monitor the progress of their Kintecus runs!
April 17th 2002
- Some international users (Germany, Poland and Russia) have noticed
that their Excel Graphical Interface bombing out. This is caused by the German, Polish,
Russian version of Excel using commas instead of points to represent numbers, ie. 3.14 is
represented by 3,14. Kintecus parses it as an invalid number. This will be fixed in the
upcoming week. Another error is Excel2000 running in WindowsXP or Windows95 reports false
Kintecus crashes. This will too be corrected in the upcoming week. For now, just ignore
the false error reported by Excel. Also, some users are complaining that they cannot
monitor the progress of their Kintecus runs in the Graphical Interface. An addition to the
Interface will be added to allow one to monitor their Kintecus runs in the Excel Graphical
Interface by next week or so...
March 10th 2002
- Kintecus for the Windows zip file now comes with an Installer. You
can directly load some of the sample graphical interface models from the Windows Start
Menu with the new Kintecus installer.
January 19th 2002
- Kintecus for LINUX has been released. Three versions are available
for Pentium I, PentiumII/PentiumIII and Pentium IV. The LINUX versions are 40-80% FASTER
than the Windows version so those with LINUX systems might be interested switching over.
December 29th 2001
- Version 2.71 of Kintecus has been released. Minor changes to
executable. The GRI-MECH sample runs have been sped up by 3-4x (300-400% increase in
speed!) due primarily to the change in the GRI-MECH's respective Accuracy field. Most
sample models for Kintecus have the Accuracy field set to a fairly conservative level
(=SLOW). The GRI-MECH sample runs and the OH-combustion runs have their Accuracy changed
to a larger value without affecting the final results. In fact, the GRI-MECH runs can be
sped up ANOTHER 2x, but with some slight changes in the final temperature &
concentrations values. Some users running Kintecus inside a large 3D diffusion/convection
grid might want to further increase the Accuracies in the GRI-MECH parm.dat files.
December 2nd 2001
- Version 2.69 of Kintecus has been released. Small bugs associated
with some error reporting routines were corrected. See bugs
page for further details.
November 10th 2001
- New Kintecus_V26_2.zip file released.
- The Chemkin to Kintecus translator program, CK2KIN.EXE,
has a serious bug in it. Depending on the conditions, it will sometimes drop a zero from a
number containing an exponent, i.e. 1.5E+30 will become 1.5E+03 or 7E+10 will become
7E+01. The Kintecus GRI-MECH-3.0 model and the ethanol combustion model (previous Chemkin
models translated into Kintecus format by CK2KIN.EXE) contain a few wrong
rates and TROE factors. Interestingly, re-running the ethanol.bat runs with the NEW
CORRECT model shows almost no difference in the ignition delay results, BUT the
GRI-MECH-3.0 model (a highly condensed kinetics mechanism) shows concentration profiles
off from 10%-40%. Although, the FINAL concentration and temperature values for the
GRI-MECH-3.0 runs are only off a few percent, primarily due to most of the reactions have
equilibrium constraints. The Kintecus V2.6 program is fine.
So, what should you do? If you do NOT use the Kintecus GRI-MECH-3.0 or
ethanol combustion models or you do NOT use the CK2KIN.EXE translator,
you can safely ignore this message. Again, Kintecus V2.6 is fine; there are
currently no known bugs in V2.6.
If you only use the ethanol combustion model, you can probably
ignore this message, but it would be wise to download the new
Kintecus Zip file (Kintecus_V26_2.ZIP). The new ZIP file contains the updated CK2KIN.EXE
program and the correct ethanol combustion model and GRI-MECH models as well as two
more additional GRI-MECH-3.0 test runs (grict2.bat and griv29.bat) to
further test the CK2KIN.EXE program against published, refereed experimental results. In
addition, the documentation has been slightly updated and a tiny .BAT file is
missing to complete the Kintecus Excel GRAPHICAL interface.
If you use the GRI-MECH model or have used the Chemkin to
Kintecus translator program CK2KIN.EXE, you should download
the new Kintecus ZIP file (Kintecus_V26_2.zip).
November 2001
- Kintecus Version 2.60 has been released
- Included in the release is a graphical interface
that runs through Excel 97/2000/XP. Click here (Graphical Interface)
to see some screen shots!
- Kintecus 2.60 allows users to run other programs to monitor the
execution of Kintecus, Fatal Errors and Warnings and also allows one to alter the output.
August 2001
- Kintecus Version 2.31 has been released
- The main new feature in Kintecus V2.3 is the ability to
fit/optimize
rate constants, initial concentrations, Lindemann/Troe/SRI/LT
parameters, enhanced third body factors, initial temperature,
residence time, energy of activation and many other parameters
against your dataset(s). Note that Kintecus will actually fit the
parameters at EXACTLY the time your data was measured. Unlike other
programs, Kintecus DOES NOT interpolate a function against your data
and then fit the values against this interpolation. There is no need
to “clean” your data, suggest interpolation methods nor specify
timing meshes against your experimental data since
Kintecus calculates values at exactly the times you specify in your
experimental datafile.
- Some other changes and additions have been
added such as the ability to view the delta-S,H,G,Kp, kr of the
reactions, and the H, S, G, Cp, Gas Density and other physical
properties of system as the simulation runs. See the .pdf file
for full descriptions.
- In addition, some users were complaining
that the Freeform spreadsheet output of Chemkin thermodynamic
databases didn't included Mw, so this has also been changed.
A new MAP keyword, CMW, has been added to convert the empirical
Mw data field into Kintecus Mw. For examples, see the ethanol
combustion, O2-OH combustion, Ozone decomposition and GRI-MECH
samples which all include this keyword. Again, please refer to the
.pdf documentation for a full description of these new features
in V2.3 and many other additions!
|