|
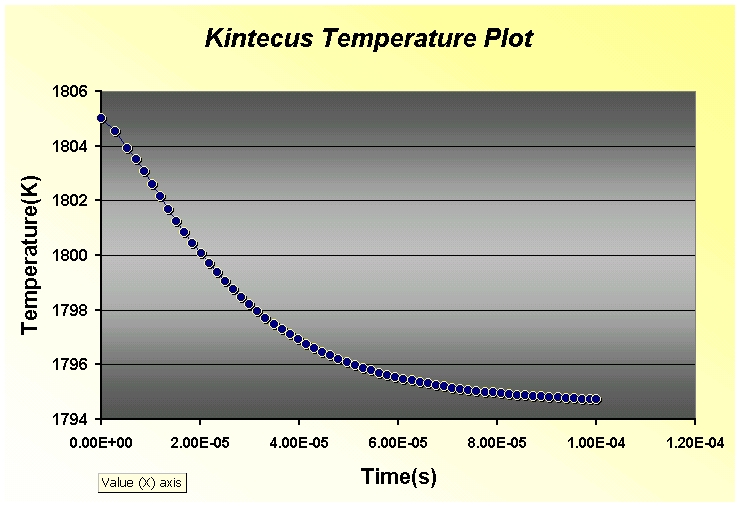
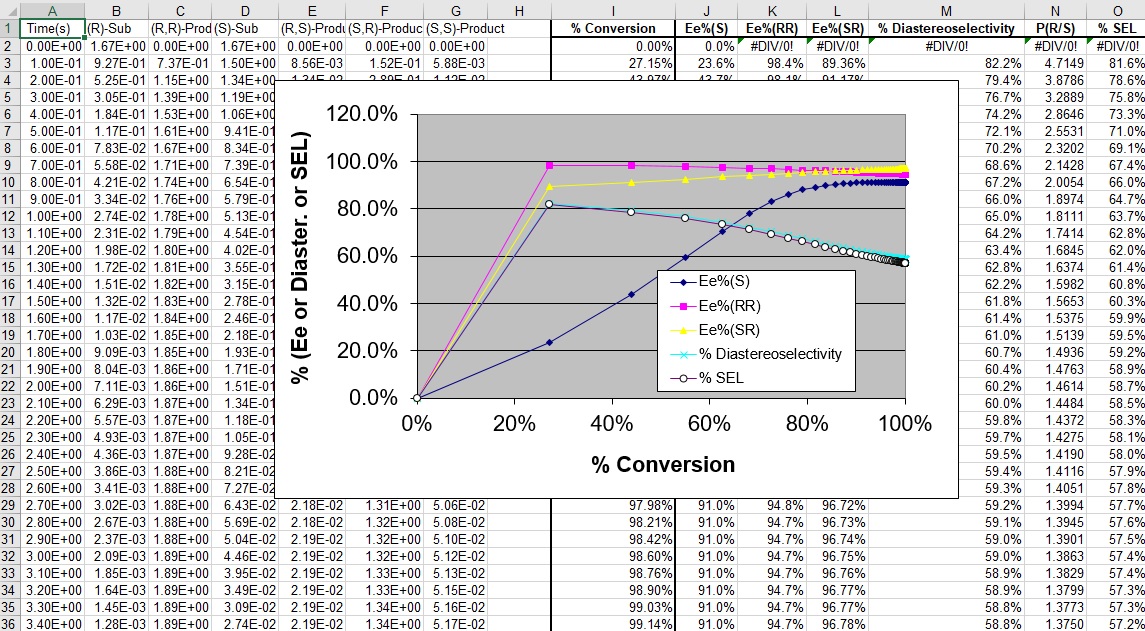
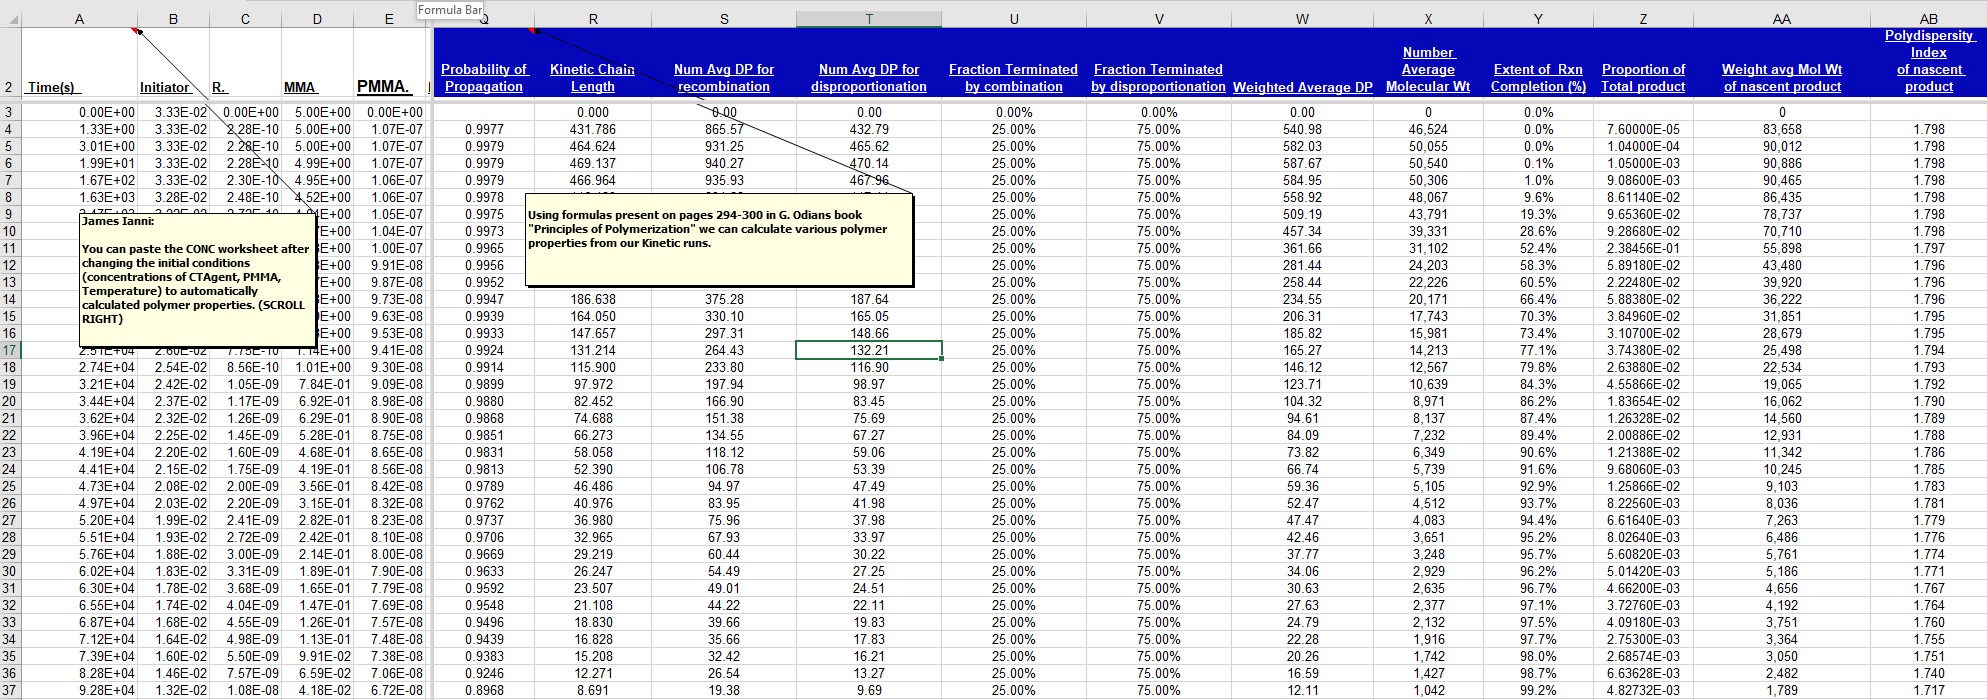
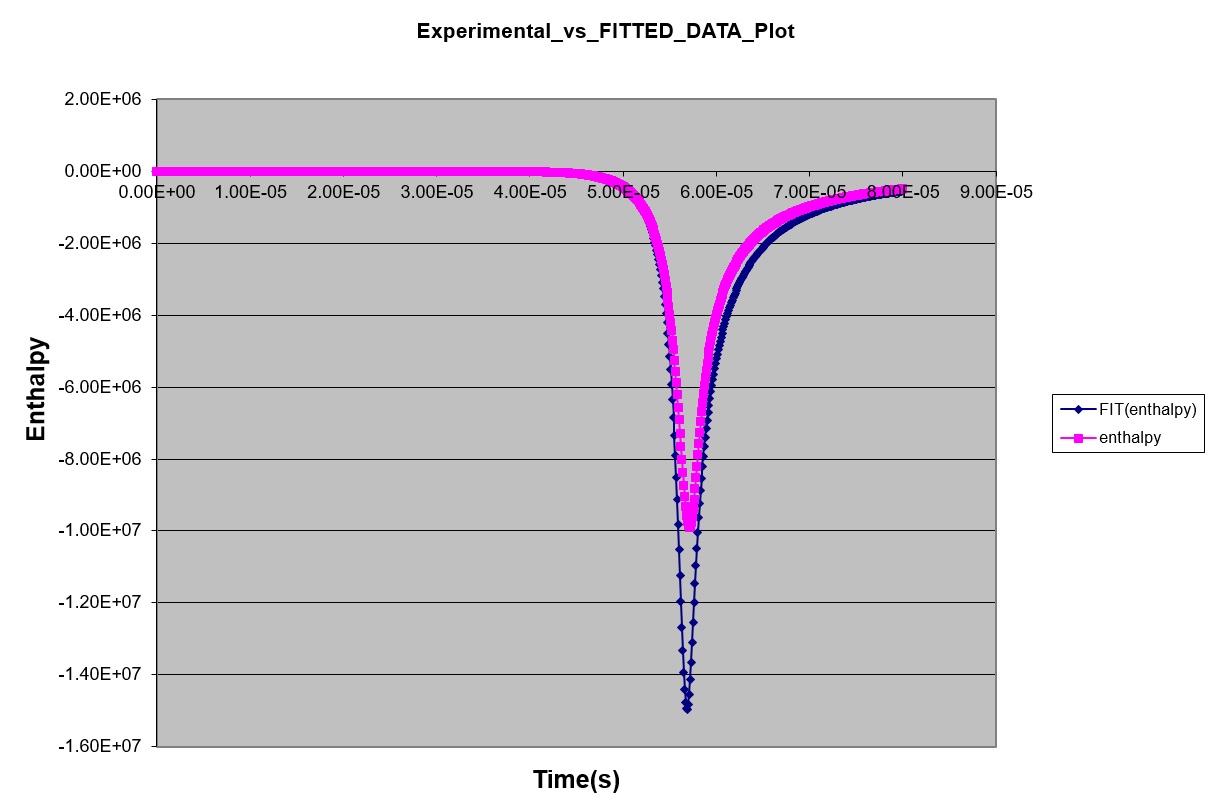
Here are some screen shots and movies of the Graphical Interface for
Kintecus:
Videos on Extracting Valuable Parameters from Multiple
Experimental Dataset(s):
1) Extracting rate constants for the non-competitive inhibition of an
enzymatic reaction system utilizing Kintecus.
This is using one dataset with missing data and uneven data spacing or
gridding
(please click full screen mode to clearly see video text):
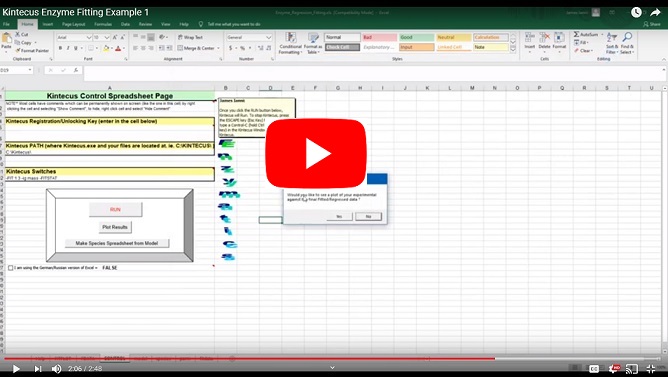
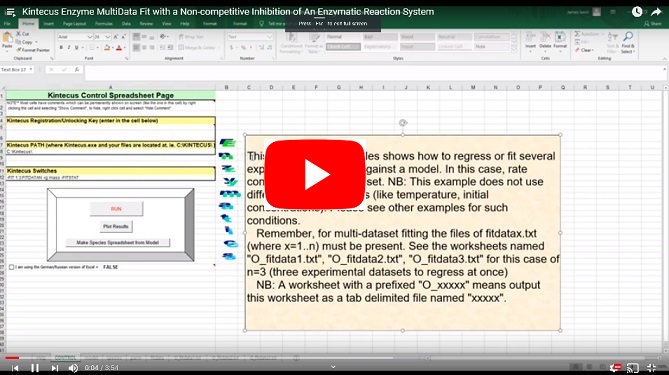
2) Kintecus Enzyme MultiData Fit with a Non-competitive Inhibition of An
Enzymatic Reaction System
This multidata fit examples shows how to regress or fit several experimental
datasets against a chemical model.
In this case, rate constants for the non-competitive inhibition of an enzymatic
reaction system.
This is using many datasets with missing data, missing data columns(!!) and
uneven data spacing or gridding.
(please click full screen mode to clearly see video text):
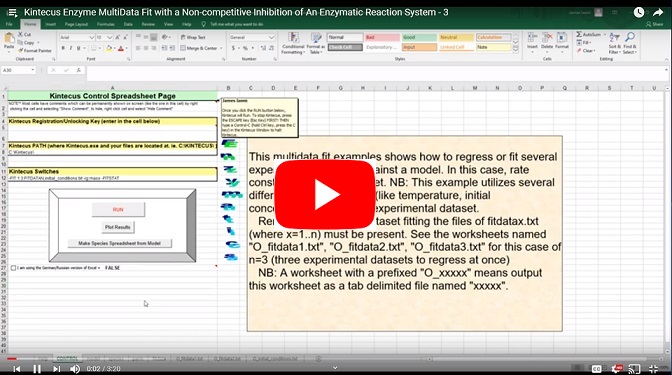
3) Kintecus Enzyme MultiData Fit with a Non-competitive Inhibition of An
Enzymatic Reaction System
WITH different initial conditions.
This multidata fit examples shows how to regress or fit several experimental
datasets against a chemical model.
In this case, rate constants for the non-competitive inhibition of an
enzymatic reaction system.
This is using many datasets with missing data, missing data columns(!!) and
uneven data spacing or
gridding and with DIFFERENT initial conditions.
(please click full screen mode to clearly see video text)
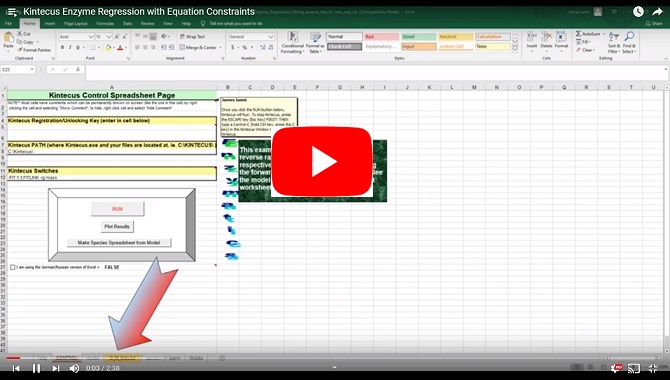
4) Kintecus Enzyme MultiData Fit with a Non-competitive Inhibition of An
Enzymatic Reaction System
WITH Equation Constraints
This multidata fit examples shows how to regress or fit several experimental
datasets against a chemical model.
In this case, rate constants for the non-competitive inhibition of an enzymatic
reaction system.
In this example shows you how to constrain reverse rate constants, kb, against
the respective equilibrium constant
while fitting the forward rate-constants using fit_links. See the model
worksheet and the O_fit_links.txt worksheet
(please click full screen mode to clearly see video text):
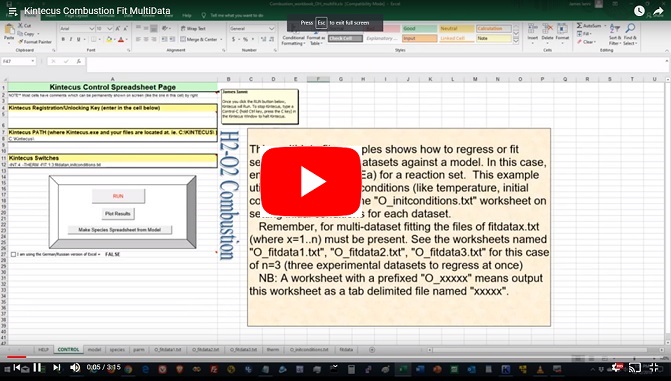
5) Kintecus Combustion Fit MultiData
This multidata fit examples shows how to regress or fit several experimental
datasets against a combustion model. In
this case, energy of activations (Ea) for a reaction set.
This example utilizes different initial conditions (like temperature, initial
concentrations). See the "O_initconditions.txt" worksheet on setting initial
conditions for each dataset.

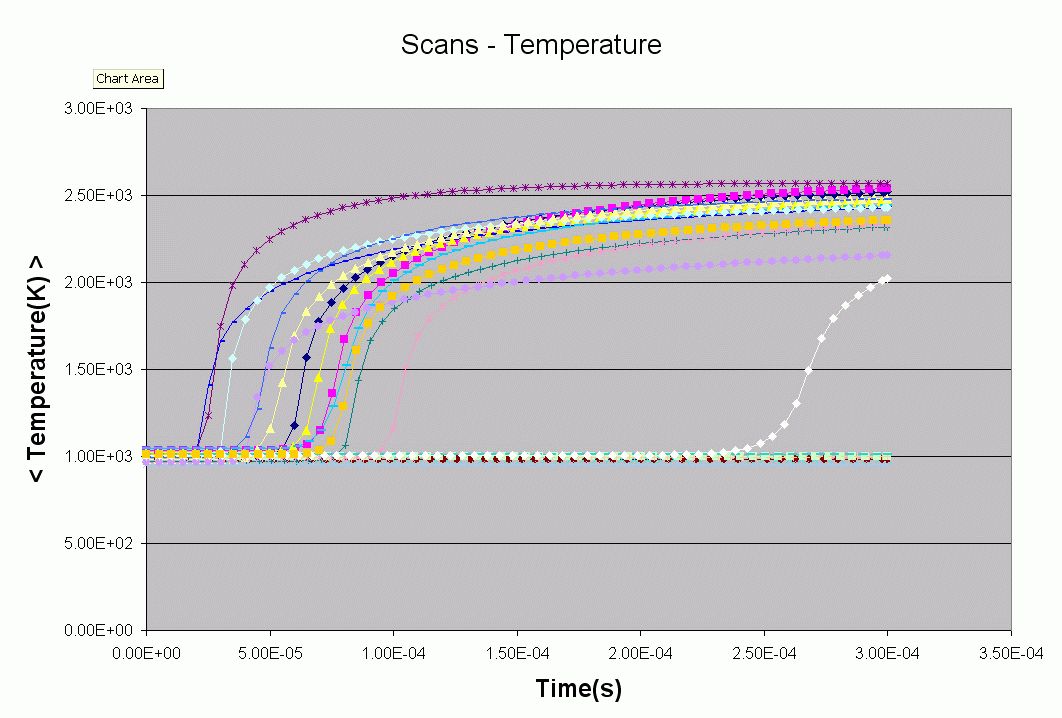
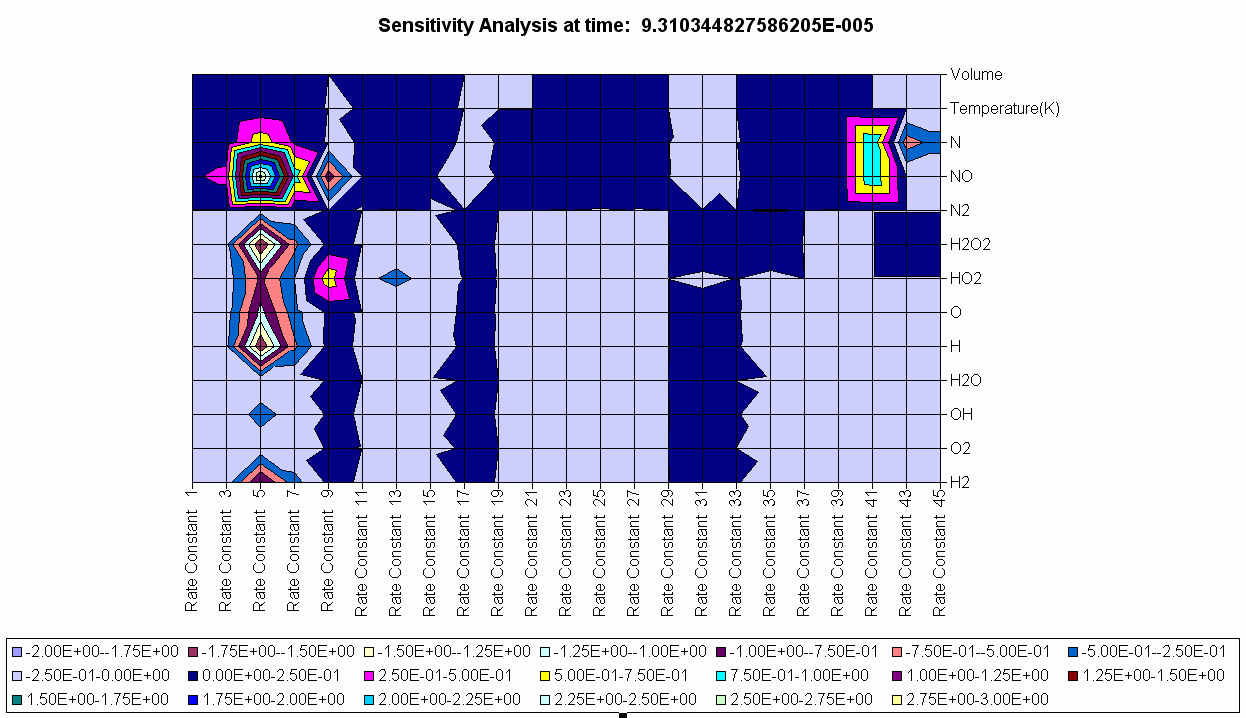
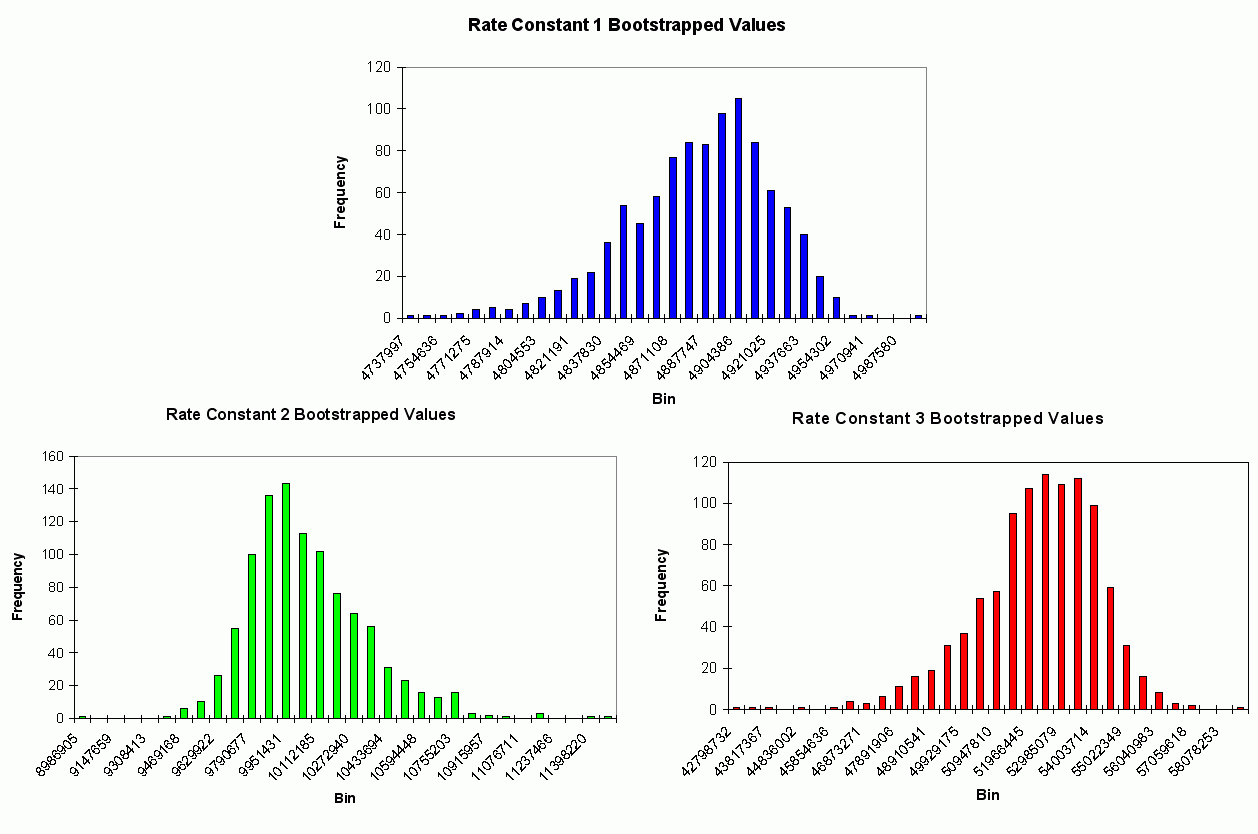
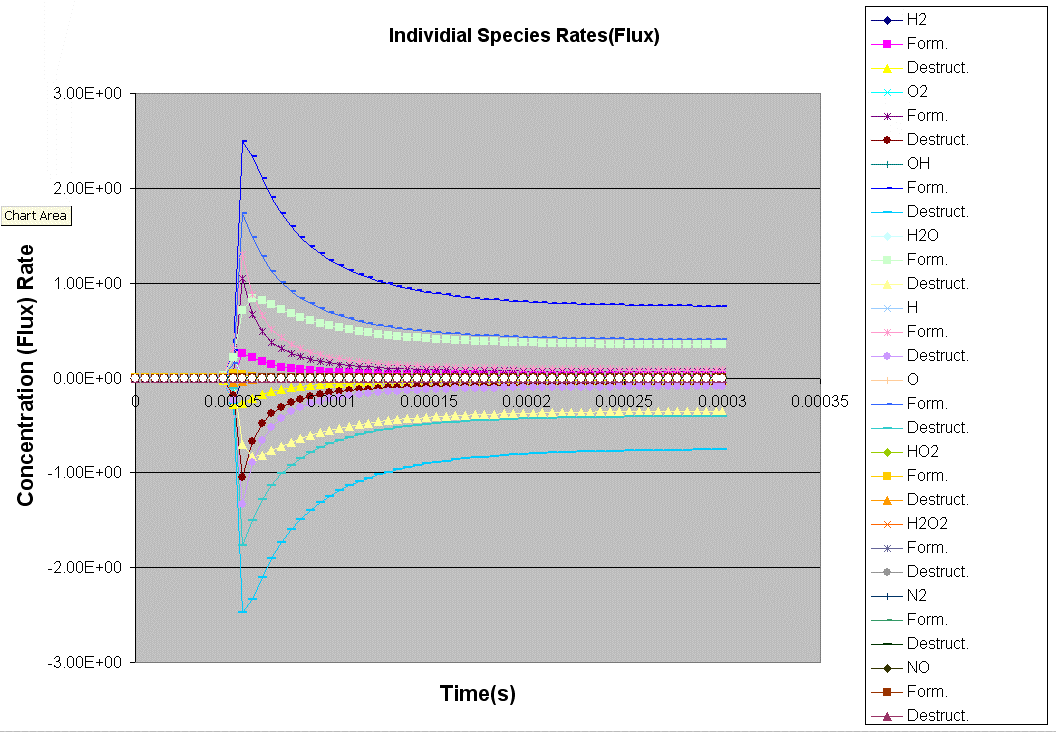
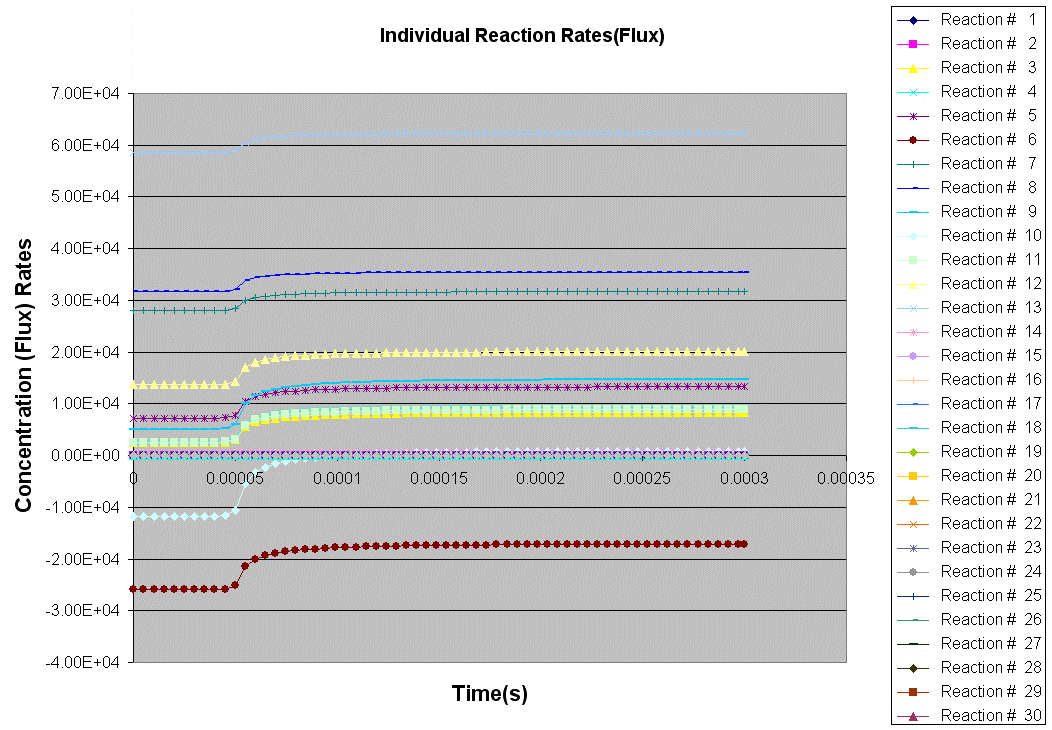
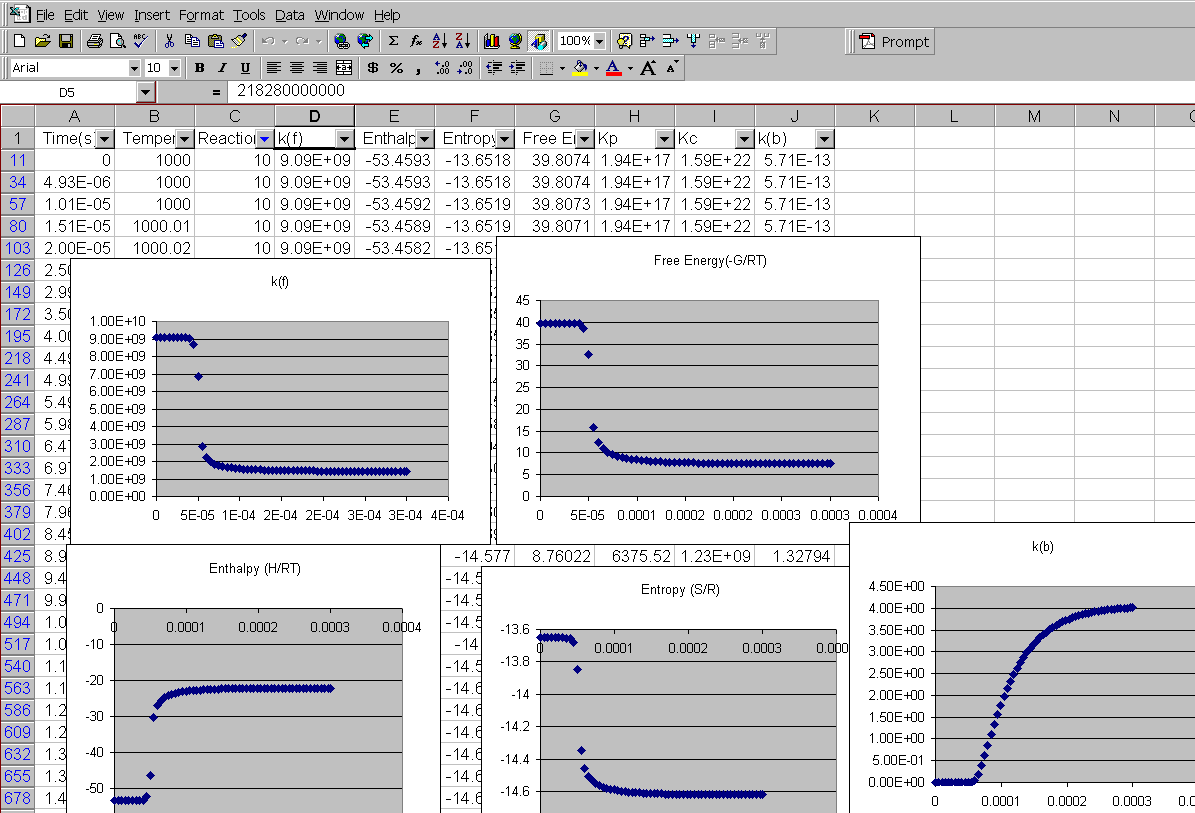
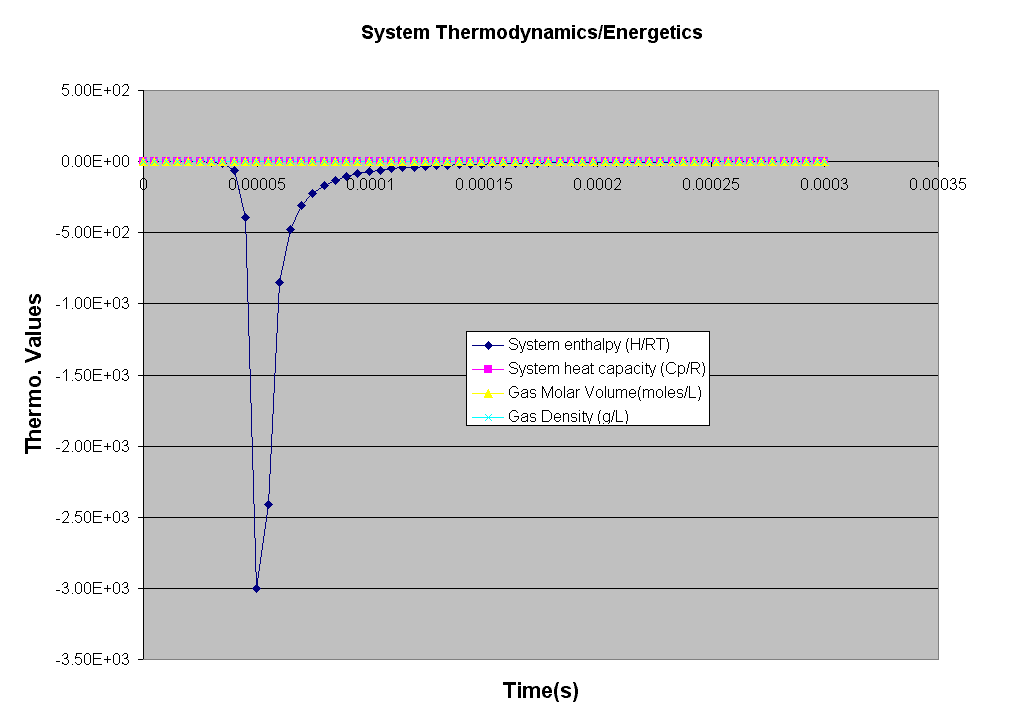
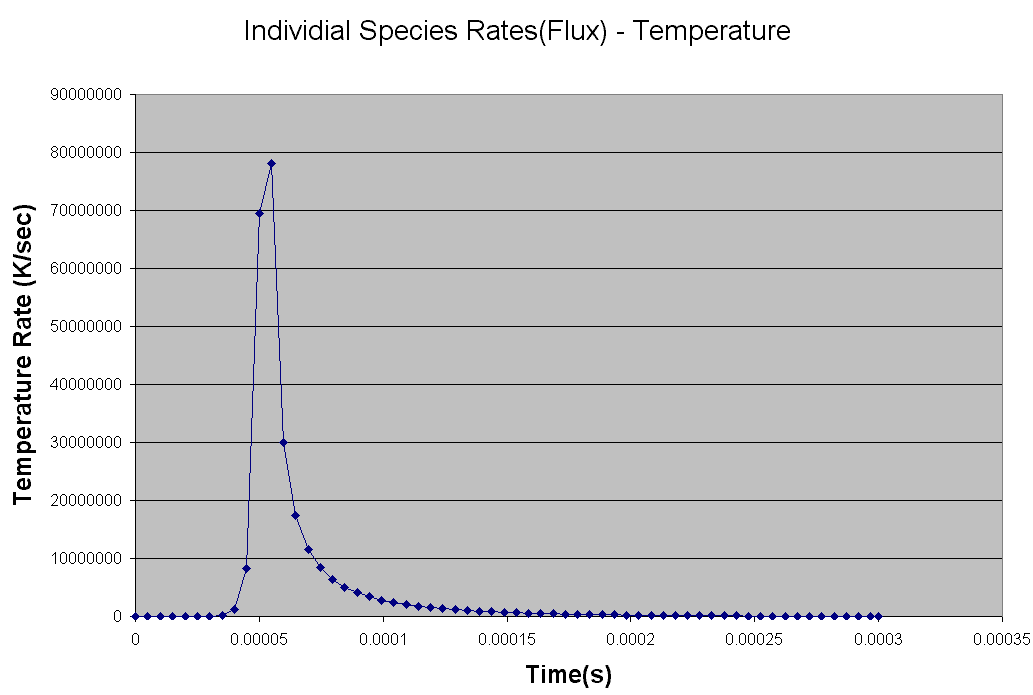
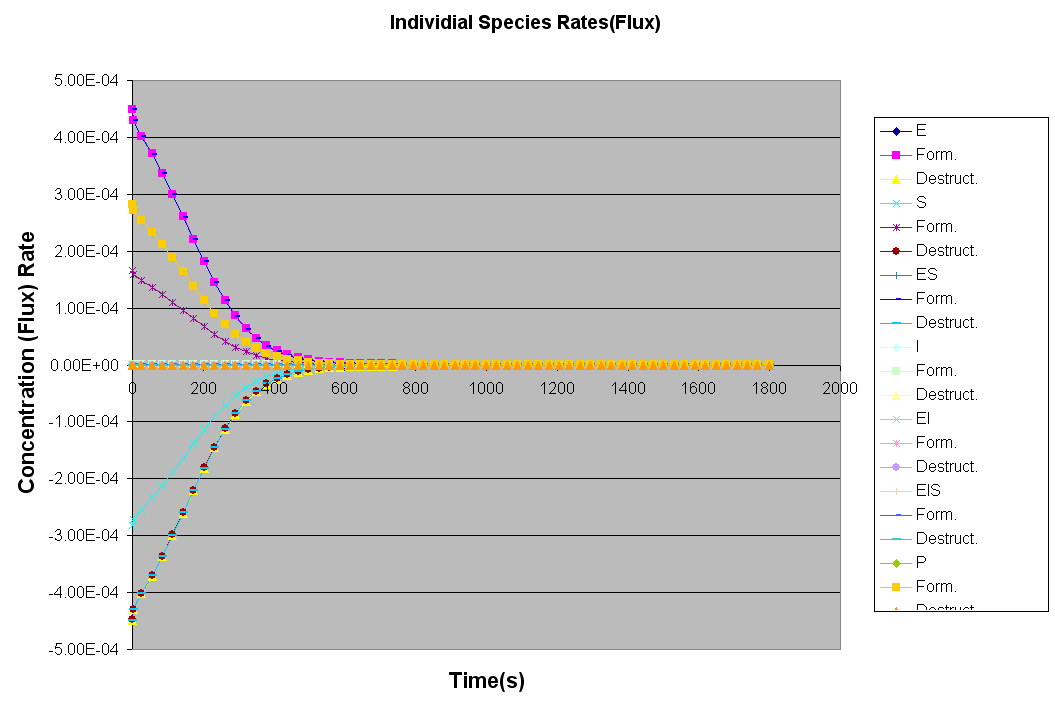
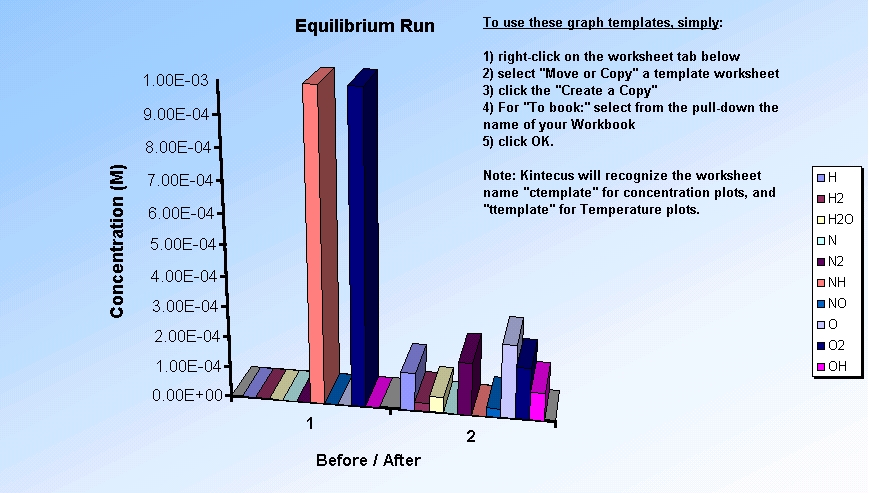
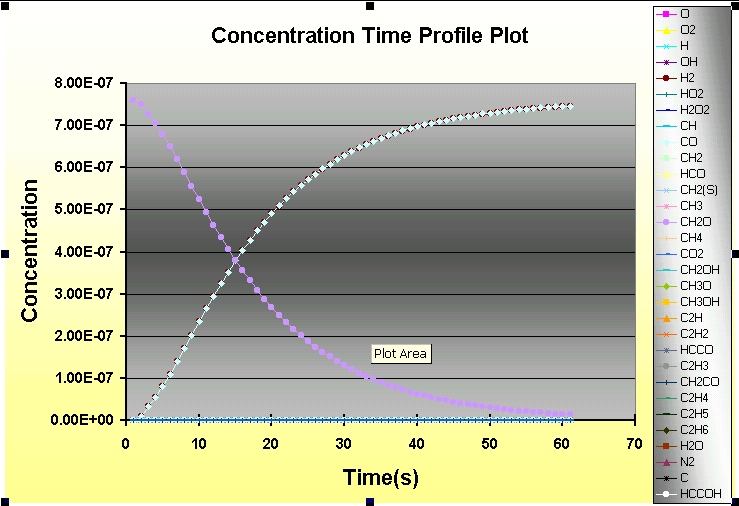
*** NEW Plots from KintecusV3.7!! ***
An extremely important new feature is the capability to
calculate model uncertainty
in order to answer questions such as:
What is the maximum dosage the patient can take?
What is the chance that the boiler/CSTR/PFR might explode or have low yield?
Why does the engine knock in real conditions, but does not do so under simulations
that use nominal values?
Why do some atmospheric simulations show high [OH] when experimental data shows
low [OH] concentrations or visa-versa ?
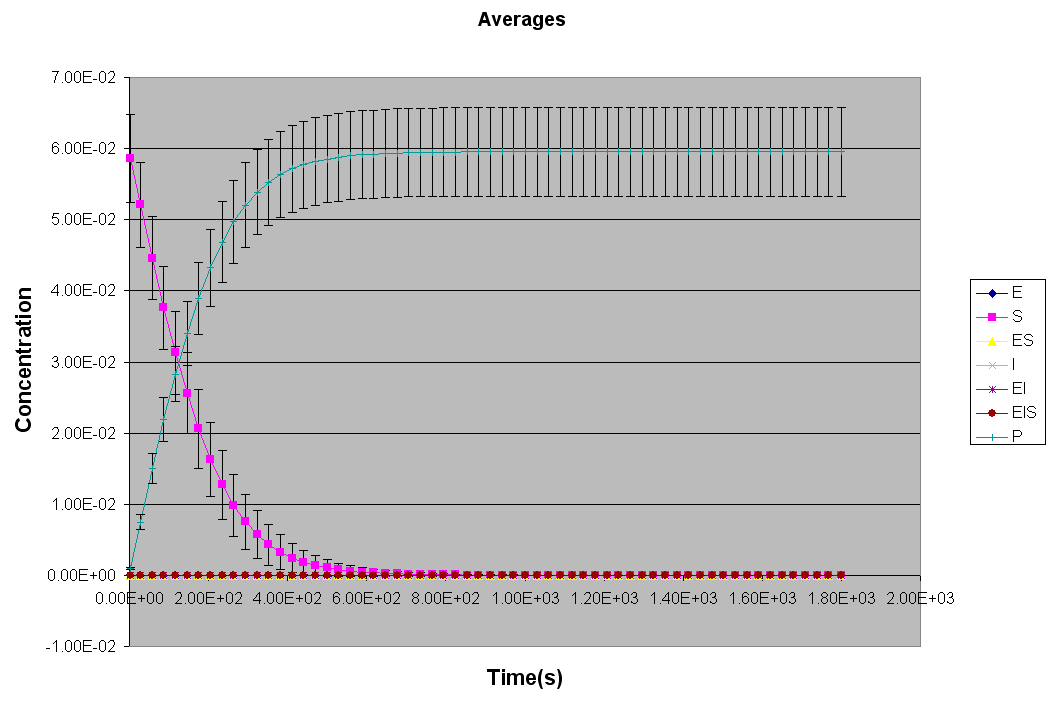
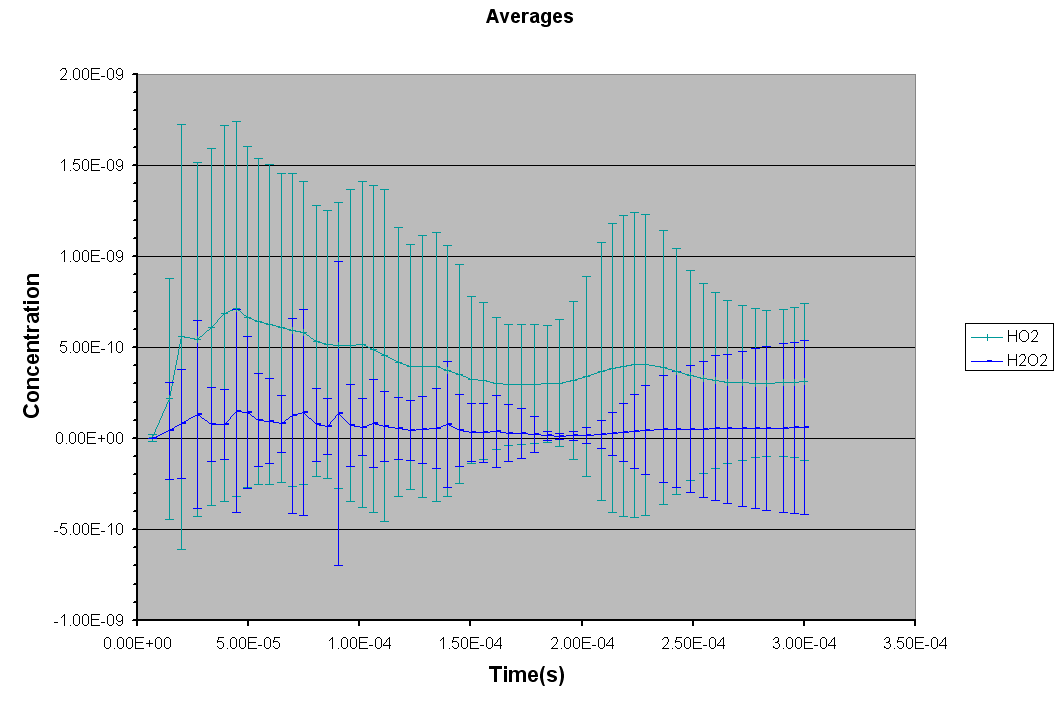
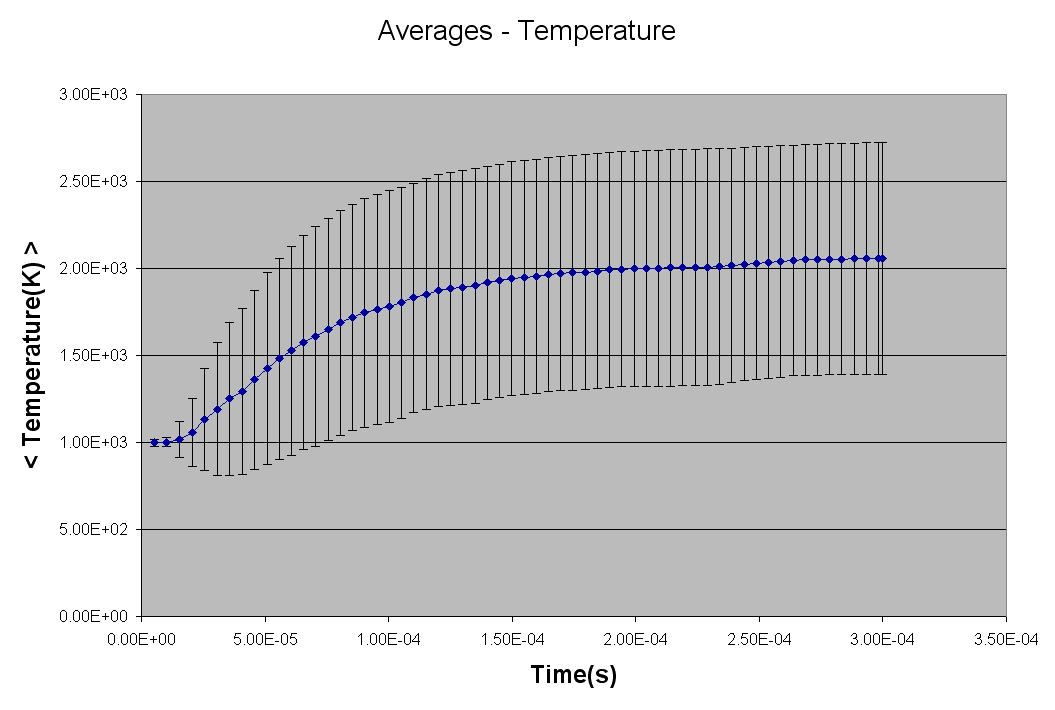
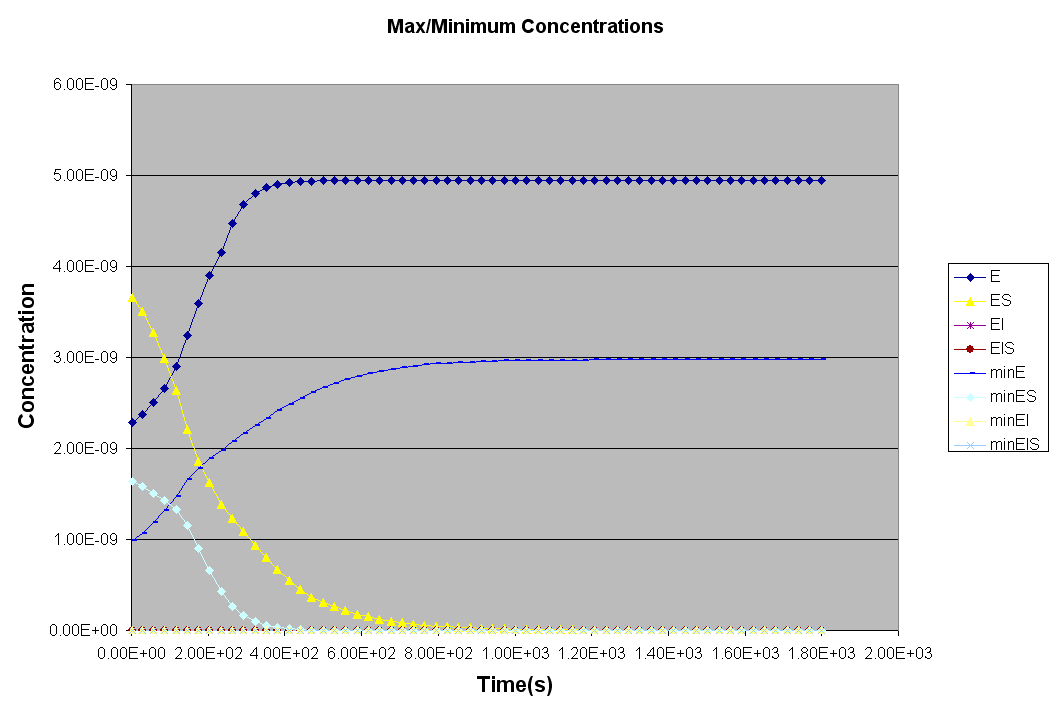
Kintecus V3.7 Excel Macros now have the
capability
to read the output from the "-o:y:y:y:y" switch:
The Kintecus Workbench : 
| 